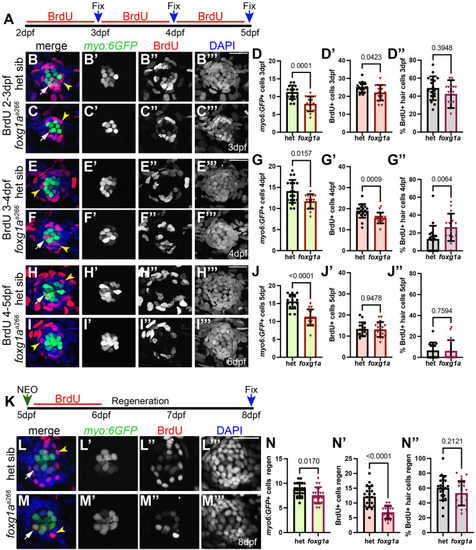
BrdU incorporation in foxg1a mutants is reduced during neuromast maturation. (A) Timeline of BrdU incorporation between 2 dpf and 5 dpf. (B-C′″-E,F′″,H-I′″,L-M′″) Confocal projections of heterozygous sibling and foxg1aa266 embryos expressing Tg(myo6:GFP) (green) following 24 h windows of BrdU (red) exposure and nuclei labeled with DAPI (blue) between 2-5 dpf. White arrows indicate representative myo6:GPF+ hair cells co-labeled with BrdU. Yellow arrowheads indicate representative neuromast cells labeled with BrdU. (B-B′″) 3 dpf heterozygous sibling and (C-C′″) foxg1aa266 mutant neuromast exposed to BrdU from 2-3 dpf. (D-D″) Quantification of heterozygous sibling and foxg1aa266 hair cells (D), total BrdU incorporation (D′), and percent of BrdU to hair cells (D″) at 3 dpf. n=17 neuromasts (nine larvae) heterozygous sibling, n=16 neuromasts (eight larvae) foxg1aa266. (E-F′″) 4 dpf heterozygous sibling (E-E′″) and foxg1aa266 mutant (F-F′″) neuromasts exposed to BrdU from 3-4 dpf. (G-G″) Quantification of heterozygous siblings and foxg1aa266 hair cells (G), total BrdU incorporation (G′), and index of BrdU to hair cells (G″) at 4 dpf. n=19 neuromasts (nine larvae) heterozygous sibling, n=15 neuromasts (eight larvae) foxg1aa266. (H-I′″) 5 dpf heterozygous sibling (H-H′″) and foxg1aa266 mutant (I-I″) neuromasts exposed to BrdU from 4-5 dpf. (J-J″) Quantification of heterozygous siblings and foxg1aa266 hair cells (J), total BrdU incorporation (J′), and index of BrdU to hair cells (J″) at 5dpf. n=15 neuromasts (eight larvae) heterozygous sibling, n=17 neuromasts (eight larvae) foxg1aa266. (K) Timeline of NEO expose at 5 dpf, followed by 24 h of BrdU incubation and then regeneration through to 8 dpf and fixation. (L-M′″) Confocal projections at 3 days-post NEO treatment at 8 dpf; hair cells and labeled with Tg(myo6:GFP) (green), proliferating cells are labeled by BrdU-incorporation (red), and nuclei labeled with DAPI (blue) in heterozygous sibling (L-L′″) and foxg1aa266 mutant (M-M′″) neuromasts. (N-N″) Quantification of hair cells (N), BrdU-labeled cells (N′), and % of BrdU+ hair cells (N″). n=21 neuromasts (7 larvae) per condition. All data presented at mean±s.d. Mann–Whitney U-tests. Scale bars: 20 µm.
|
