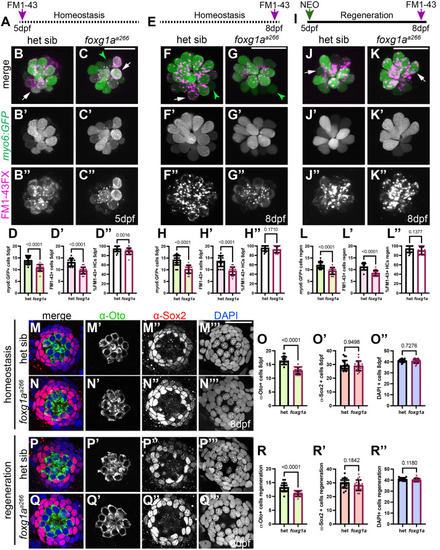
Loss of Foxg1a function reduces hair cell development and regeneration. (A) Timeline of FM1-43FX exposure and live imaging at 5 dpf. (B-C″) Live confocal projections of Tg(myo6:GFP)-labeled (green) and FM1-43FX-labeled (magenta) neuromasts in heterozygous (B-B″) and foxg1aa266 mutant larvae (C-C″) at 5 dpf, white arrows indicate co-labeling of myo6:GFP and FM1-43FX and green arrowheads indicate only myo6:GFP labeling. (D-D″) Quantification of myo6(GFP)+ hair cells (D), FM1-43FX+ hair cells (D′), and the percentage of FM1-43FX+ hair cells (D″) at 5 dpf. n=17 neuromasts (11 larvae) heterozygous sibling and n=19 neuromasts (ten larvae) foxg1aa266 mutants. (E) Timeline of FM1-43FX exposure and live imaging at 8 dpf. (F-G″) Live confocal projections of Tg(myo6:GFP)-labeled (green) and FM1-43FX-labeled (magenta) neuromasts in heterozygous (F-F″) and foxg1aa266 mutant larvae (F-G″) at 8 dpf. (H-H″) Quantification of myo6(GFP)+ hair cells (H), FM1-43FX+ hair cells (H′), and the percentage of FM1-43FX+ hair cells (H″) at 8 dpf. n=16 neuromasts (eight larvae) heterozygous sibling and n=17 neuromasts (nine larvae) foxg1aa266 mutants. (I) Time line of NEO-exposure, regeneration, and FM1-43 labeling. (J-K″) Live confocal projections of Tg(myo6:GFP)-labeled (green) and FM1-43FX-labeled (magenta) neuromasts in heterozygous (J-J″) and foxg1aa266 mutant larvae (K-K″) following regeneration at 8 dpf. (L-L″) Quantification of Tg(myo6:GFP)+ hair cells (L), FM1-43FX+ hair cells (L′), and the percentage of FM1-43FX+ hair cells (L″) following regeneration. n=14 neuromasts (seven larvae) heterozygous sibling and n=15 neuromasts (eight larvae) foxg1aa266 mutants. (M-N′″) Confocal projections of 8 dpf larvae showing hair cells labeled with α-Oto antibody (green), support cells labeled with α-Sox-2 antibody (red), and nuclei labeled with DAPI in heterozygous sibling (M-M′″) and foxg1aa266 (N-N′″) neuromasts. (O-O″) Quantification of α-Oto+, α-Sox-2 +, and DAPI+ cells. n=19 neuromasts (ten larvae) heterozygous sibling and n=20 neuromasts (ten larvae) foxg1aa266 mutants. (P-Q′″) Confocal projects of 8dpf larvae following NEO-exposure and regeneration showing hair cells labeled with α-Oto antibody (green), support cells labeled with α-Sox-2 antibody (red), and nuclei labeled with DAPI in heterozygous sibling (P-P′″) and foxg1aa266 (Q-Q′″) neuromasts. (R-R″) Quantification of regenerated α-Oto+, α-Sox-2 +, and DAPI+ cells. n=17 neuromasts (nine larvae) heterozygous sibling and n=18 neuromasts (nine larvae) foxg1aa266 mutants. Data presented as mean ±s.d., Mann–Whitney U-test. Scale bars: 20 µm.
|
