
Fig. 2.
- ID
- ZDB-IMAGE-240926-10
- Publication
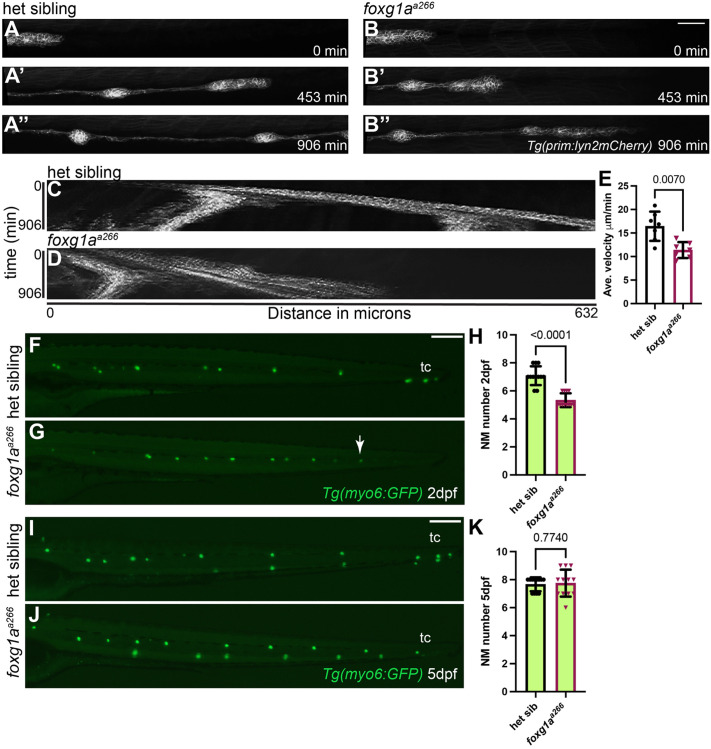
- Bell et al., 2024 - foxg1a is required for hair cell development and regeneration in the zebrafish lateral line
- All Figures
- Figures for Bell et al., 2024
|
Fig. 2.