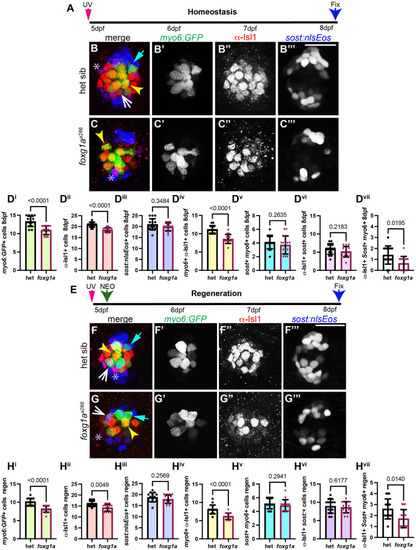
α-Islet1 antibody and sost:nlsEos label differentially label regenerating hair cells. Confocal projections of neuromasts showing hair cells labeled with myo6:GFP (green), central cells and hair cells labeled with α-Isl1 antibody (red), and sost:nlsEos cells (blue). Examples of hair cells that are both myo6:GFP+ and sost:nlsEos are marked with cyan arrows, hair cells that are both myo6:GFP+ and α-Isl1+ are marked with yellow arrowheads, hair cells that are myo6:GFP+, α-Isl1+, and sost:nlsEos+ are marked by white arrows, and cells that are α-Isl1+ and sost:nlsEos+ are marked with purple asterisks. (A) Timeline of UV photoconversion of sost:nlsEos cells at 5 dpf, homeostasis for 3 days, and fixation at 8 dpf. (B-C′″) Heterozygous sibling and foxg1a266 mutants neuromasts at 8 dpf. (Di-Dvii) Quantification of myo6:GFP+ hair cells (Di), α-Isl1+ cells (Dii), sost:nlsEos+ cells (Diii) cells labeled with both myo6:GFP and α-Isl1 (Div), hair cells labeled with myo6:GFP and sost:nlsEos (Dv), cells labeled with sost:nlsEos and α-Isl1 (Dvi), and cells labeled with myo6:GFP, α-Isl1, and sost:nlsEos (Dvii), n=15 neuromasts (eight larvae) heterozygous siblings and 14 neuromasts (eight larvae) foxg1a266 mutants. (E) Timeline of UV photoconversion of sost:nlsEos cells and NEO exposure at 5 dpf, regeneration for 3 days, and fixation at 8 dpf. (F-G′″) Heterozygous sibling and foxg1a266 mutants neuromasts at 8 dpf. (Hi-Hvii) Quantification of myo6:GFP+ hair cells (Hi), α-Isl1+ cells (Hii), sost:nlsEos+ cells (Hiii) cells labeled with both myo6:GFP and α-Isl1 (Hiv), hair cells labeled with myo6:GFP and sost:nlsEos (Hv), cells labeled with sost:nlsEos and α-Isl1 (Hvi), and cells labeled with myo6:GFP, α-Isl1, and sost:nlsEos (Hvii), n=15 neuromasts (eight larvae) heterozygous siblings and 14 neuromasts (nine larvae) foxg1a266 mutants. All data presented at mean±s.d. Significance was determined with Mann–Whitney U-tests. Scale bars: 20 µm.
|
