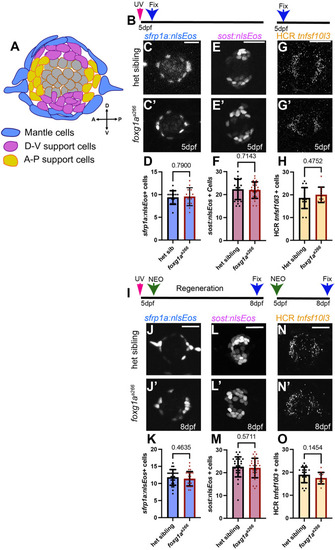
Support cell populations are unaffected by loss of Foxg1a during development. (A) Schematic of a neuromast showing peripheral mantle cells (blue), dorsoventral cells (purple), and anterior-posterior cells (yellow). (B) Timeline of UV photo-conversion of nlsEos and fixation of larvae at 5 dpf. (C-C′) Confocal projection of photo-converted Tg(sfrp1a:nlsEos)-expressing support cells in 5 dpf heterozygous sibling (C) and foxg1aa266 larvae (C′). (D) Quantification of Tg(sfrp1a:nlsEos)-positive dorsoventral support cells. n=14 neuromasts (eight larvae) heterozygous sibling, n=13 neuromasts (six larvae) foxg1aa266. (E-E′) Confocal projection of Tg(sost:nlsEos)-expressing dorsoventral support cells in 5 dpf heterozygous sibling (E) and foxg1aa266 larvae (E′). (F) Quantification of Tg(sost:nlsEos)-positive dorsoventral support cells. n=23 neuromasts (eight larvae) per condition. (G-G′) Confocal projections of FISH HCR for tnfsf10l3 in 5 dpf heterozygous sibling (G) and foxg1aa266 larvae (G′). (H) Quantification of tnfsf10l3+ cells. n=17 neuromasts (eight larvae) heterozygous, n=11 neuromasts in foxg1aa266. (I) Timeline of photo-conversion and regeneration to 8 dpf after NEO-exposure at 5 dpf. (J-J′) Confocal projection of photo-converted Tg(sfrp1a:nlsEos)-expressing support cells in 8 dpf heterozygous sibling (J) and foxg1aa266 larvae (J′). (K) Quantification of Tg(sfrp1a:nlsEos)-positive support cells. n=22 neuromasts (eight larvae) heterozygous sibling, and n=27 neuromasts (ten larvae) foxg1aa266. (L-L′) Confocal projection of photo-converted Tg(sost:nlsEos)-expressing dorsoventral support cells in 8 dpf heterozygous sibling (L) and foxg1aa266 larvae (L′). (M) Quantification of Tg(sost:nlsEos)-positive support cells. n=28 neuromasts (ten larvae) heterozygous sibling, n=27 neuromasts (nine larvae) foxg1aa266. (N-N′) Confocal projections of HCR fluorescent in situ for tnfsf10l3 in 8 dpf heterozygous sibling (N) and foxg1aa266 larvae (N′). (O) Quantification of tnfsf10l3+ cells. n=20 neuromasts (ten larvae) heterozygous sibling larvae, and n=11 neuromasts in seven foxg1aa266 larvae. All quantification data presented as mean±s.d. Mann–Whitney U-test. Scale bars: 20 µm.
|
