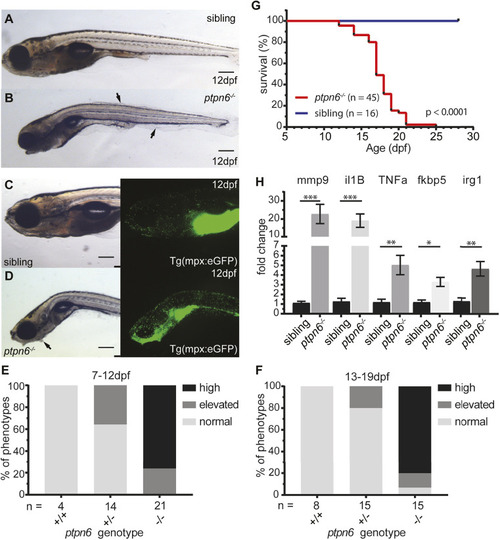
Zebrafish ptpn6 mutants show an inflammatory response with neutrophil accumulation and do not survive to adulthood. (A-D) Representative pictures of embryos at 12 dpf by stereo microscopy. The larvae were genotyped by PCR and sequencing following imaging. Siblings (A,C) and ptpn6−/− mutants (B,D) displaying the motheaten-like phenotype. Arrows indicate the affected epithelia. GFP-positive neutrophils in tg(mpx:eGFP) transgenic lines (C,D, right) localize to the gill and mandibular area in ptpn6−/− embryos. Scale bars: 0.5 mm (A-D). (E,F) Scoring of phenotypes in age cohorts of larvae. Larvae with an affected phenotype were selected along with age-matched controls and the number of neutrophils was scored by eye. Subsequently, the larvae were genotyped by PCR and sequencing. Larvae were classified as normal (distribution and number of neutrophils as in WT larvae), elevated (mildly increased number of neutrophils in gill and mandibular area) or high (massive increase of neutrophil numbers in the gill and mandibular area). (G) Survival curve of ptpn6 mutants. Larvae were monitored during raising, sacrificed at a defined end point (curved, skinny body, not able to swim upright and/or severe skin alterations) and genotyped by PCR and sequencing. Curve comparison was performed by log-rank (Mantel–Cox) test. (H) Increased expression of pro-inflammatory genes in mutants. RNA was extracted from larvae sacrificed upon observation of a severe phenotype (n=12) and their age-matched siblings (n=9). Gene expression was determined by qPCR and fold changes were calculated per time point (10, 14 and 18 dpf) and pooled afterwards. Statistical comparisons were performed by non-parametric ANOVA (Kruskal–Wallis) followed by multiple comparisons (original false discovery rate method of Benjamini–Hochberg). *P<0.05; **P<0.01; ***P<0.001. Error bars show the s.e.m.