
Fig. 6.
- ID
- ZDB-FIG-230217-147
- Publication
- Allers et al., 2023 - Loss of Shp1 impairs myeloid cell function and causes lethal inflammation in zebrafish larvae
- Other Figures
- All Figure Page
- Back to All Figure Page
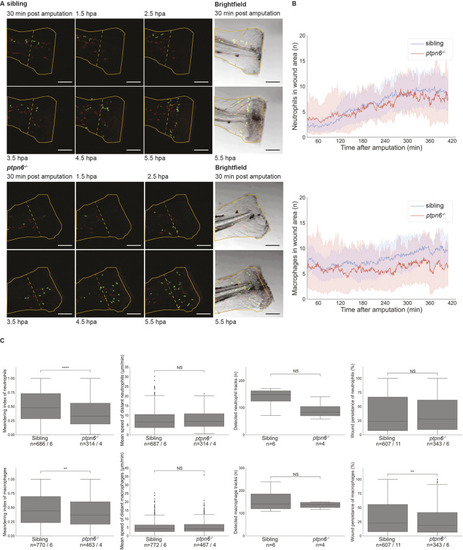
Neutrophil and macrophage migration is affected upon tail fin fold amputation in Shp1 mutants. Embryos were genotyped by PCR and sequencing following imaging. (A) Still images from live imaging of mutant and sibling 4 dpf embryos in tg(mpx:GFP/mpeg:mCherry) background show neutrophils in green and macrophages in red. Embryos were imaged every minute for 7 h; see Movies 1 and 2. The outline of the amputated fin-fold at the start of imaging is indicated with a solid orange line. The border of the wound area is indicated with a dashed orange line. Scale bars: 100 μm. hpa, hours post amputation. (B) Cells were detected using TrackMate. Cells within 200 µm of the wound were counted in every frame from 30 min after amputation to 410 min after amputation. The shaded areas represent the results of bootstrapping. Results of six mutants and 11 siblings were analyzed and compared by ordinary least-squares regression (statmodels). For neutrophils, P=0.78 and 95% c.i. coefficient=−2.10 to −1.54; for macrophages, P<0.0001 and 95% c.i. coefficient=−0.24 to 0.02. (C) The meandering index and mean speed were determined for the distant cells (further than 200 µm from the wound edge) of six siblings and four mutant embryos. The meandering index was defined as the net distance traveled by the total distance traveled of a track. All results of the measurements in C were compared using unequal variance two-tailed unpaired t-test (SciPy) and two-sided 95% c.i. (statmodels). The meandering index was significantly reduced for neutrophils (P<0.0001, 95% c.i.=0.48 to 0.52 versus 0.36 to 0.42; and for macrophages, P=0.0014, 95% c.i.=0.39 to 0.44 versus 0.45 to 0.49). The mean speed was not significantly different for neutrophils (P=0.5, 95% c.i.=7.3 to 8.1 versus 7.4 to 8.5) and macrophages (P=0.48, 95% c.i.=4.82 to 5.35 versus 4.89 to 5.61). The number of tracks was not significantly different for the entire tail of six siblings and four mutant embryos (neutrophils, P=0.092; macrophages, P=0.37). Wound persistence was determined for all cells that entered the wound area of 11 siblings and six mutants. For neutrophils, P=0.78, 95% c.i.=0.35 to 0.41 versus 0.35 to 0.42; for macrophages, P=0.014, 95% c.i.=0.33 to 0.38 versus 0.28 to 0.34. NS, not significant; **P<0.01; ****P<0.0001. Box plots show quartiles of data, the whiskers show the distribution of the data points within 1.5 times interquartile range, and the median is marked with a line. Outliers were determined as datapoints outside 1.5 interquartile range. The numbers of cells and number of embryos are mentioned as n=cells/embryos. |
| Fish: | |
|---|---|
| Condition: | |
| Observed In: | |
| Stage: | Day 4 |