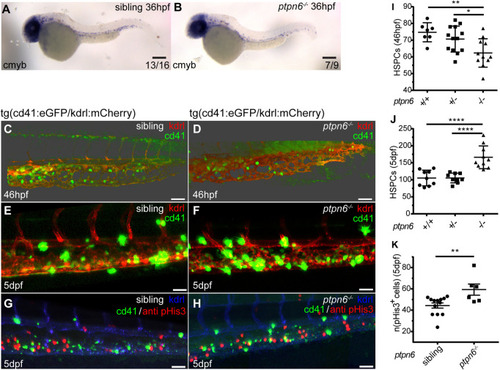
HSPCs in ptpn6 mutant embryos. (A,B) Stereo images of cmyb in situ staining, an HSPC marker, at 36 hpf. The number of embryos showing the depicted pattern/total number of embryos is shown in the bottom right corner. Scale bars: 0.2 mm. (C-H) Confocal images of the CHT of tg(cd41:eGFP/kdrl:mCherry) zebrafish, acquired using a 40× objective and pinhole of 2 AU. The cd41:eGFP transgene marks thrombocytes at later stages (GFPhigh) and HSPCs (GFPlow); the kdrl:mCherry transgene marks endothelial cells, including HSPCs that were derived from endothelial cells. (C,D) Embryos were selected and fixed at ∼46 hpf, when no GFPhigh cells marking thrombocytes were present yet, only GFPlow-positive HSPCs. Whole-mount immunohistochemistry was performed using a GFP-specific antibody. Representative 3D blended rendering images of the CHT of 46 hpf embryos are shown. Step size: 1.5 µm. Scale bars: 60 µm. (E,F) Live imaging of 5 dpf embryos. Representative 3D maximum-intensity projection images of part of the imaged region of the CHT are shown. Step size: 2 µm. Scale bars: 40 µm. (G,H) 5 dpf embryos were fixed and whole-mount immunohistochemistry was performed using a pHis3-specific (proliferation marker) and GFP-specific (GFPlow indicates HSPCs) antibody. Representative 3D maximum-intensity projection images of part of the imaged CHT are depicted. Step size: 2 µm. Scale bars: 40 µm. (I,J) Quantification of cells in confocal images using Imaris, indicating the numbers of GFP-positive HSPCs in the CHT of 46 hpf embryos (I) and GFPlow HSPCs in the CHT of 5 dpf embryos (J). Statistical comparisons were performed by one-way ANOVA followed by Tukey's multiple comparisons test. (K) Quantification of pHis3-positive cells in the CHT of 5 dpf embryos. All embryos were genotyped following in situ hybridization, immunohistochemistry and imaging by PCR and sequencing. Means were compared using a two-tailed unpaired Student's t-test. *P<0.05; **P<0.01; ****P<0.0001. Error bars show the s.e.m.