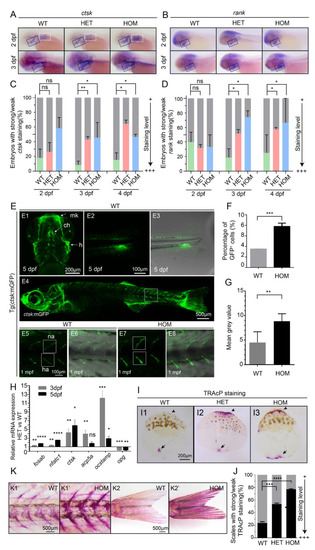
Overproduction of osteoclast cells in mafbb mutants. (A,B) WISH of ctsk and rank in embryos at 2–3 dpf. Black boxes indicate the pharyngeal arches; white boxes indicate the pectoral fins. (C,D) Quantification of the ctsk and rank expression during the early stages of development. 30–50 embryos were examined for each group. (E) Fluorescent images of Tg(ctsk:mGFP) at 5 dpf (E1–3) and 1 mpf (E4–6) in WT embryos, and at 1 mpf in HOM embryos (E7,8). E1, the ventral view of the head; Meckel’s cartilage (mk), ceratohyal (ch), hyosymplectic (h); E2, the lateral view of the tail; E3, overlay of E2 and transmitted light brightfield image; E4, the lateral view of 1 mpf Tg (ctsk:mGFP); E5–8, higher magnifications of boxed area in E4, neural arch (na); hemal arch (ha); E6 and E8, overlay of fluorescence and transmitted light brightfield image; E5,6, WT; E7,8, HOM. (F) Quantification of ctsk-GFP+cells in embryos by flow cytometry in Tg (ctsk:GFP) embryos at 5 dpf. (G) Mean grey value of GFP fluorescence intensity in the white boxes in E5 and E7. 3 fish were analyzed for each group. (H) Relative expression of genes involved osteoclast development (fosab; nfatc1; ctsk; acp5a; ocstamp; opg) in ctsk-GFP+ cells sorted from WT and HET embryos at 3–5 dpf. (I) Representative images of TRAcP histochemical staining on scales from adult zebrafish. The arrows and arrowheads point to the increased TRAcP activity, and the arrowheads point to the scale border. (J) Summary of the scales from different adult zebrafishes with TRAcP staining (n = 296–488 scales from 3 zebrafish per group; weak staining as in I1, strong staining as in I2,3 with increased TRAcP coloring along the scale border). (K) TRAcP staining of 2 mpf zebrafish. Vertebral columns (K1&K1′) and caudal fins (K2&K2′). 3 zebrafish were examined for each group with a consistent phenotype. WT, wild type; HET, mafbbd11/+; HOM, mafbbd11/d11. Results in C, F, G, H and J are expressed as mean ± SEM, (* p < 0.05, ** p < 0.01, *** p < 0.001, **** p < 0.0001, t test, ns, not significant).
|
