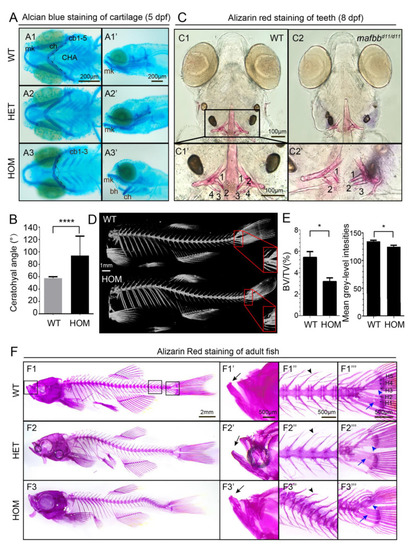
Abnormal cartilage and bone formation in mafbb mutants. (A) Alcian Blue staining of embryos at 5 dpf. A1-A3, ventral views; A1′-A3′, lateral views. Ceratobranchial pairs (cb); ceratohyal (ch); Meckel’s cartilage (mk); basihyal (bh), CHA (ceratohyal angel). (B) Summary of CHA in embryos at 5 dpf (n = 15 embryos per group). (C) Ventral views of Alizarin Red (AR) staining of larvae at 8 dpf. C1′ and C2′ are the enlarged images of the teeth region (n = 30 embryos per group). (D) MicroCT scans of adult zebrafish at 10 mpf. The hypurals in the red boxed area are used for analysis in E. (E) Summary of BV/TV for the bones in the boxed area in D (n = 3 zebrafish per group); mean grey-level intensities of the boxed area in D. (F) AR staining of adult zebrafish at 9 mpf. F1′–F3′″ are higher magnifications of boxed area in F1–F3. Mouths (F′), vertebral columns (F″) and caudal fins (F′″). The black arrows in F1′–F3′ point to the lower jaw; the black arrowheads in F2″-F3″ point to the neural arches; the blue arrowheads in F1′″–F3′″ point to hypurals 3–5 (H3–5); The blue arrows point to H1,2; N = 3 zebrafish per group. WT, wild type; HET, mafbbd11/+; HOM, mafbbd11/d11; BV, bone volume; TV, total tissue volume. Results in B and E are expressed as mean ± SEM, (* p < 0.05, **** p < 0.0001, t test).
|
