FIGURE

Figure 5.

ID
ZDB-FIG-200225-18
Publication
Roussel et al., 2020 - Spatiotemporal transition in the role of synaptic inhibition to the tail beat rhythm of developing larval zebrafish
Other Figures
All Figure Page
Back to All Figure Page
Figure 5.

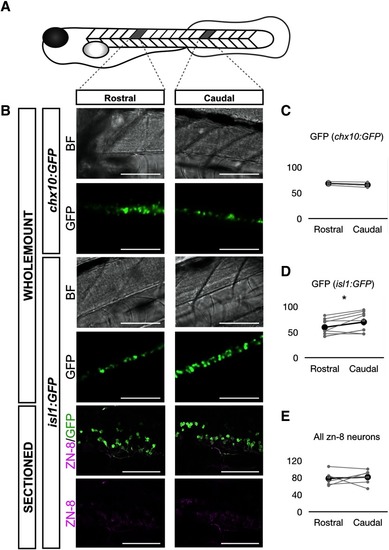
Cell count of sMNs and chx10+ spinal neurons in 3-dpf larval zebrafish. A, Schematic of the positions at which Z-stacks were imaged. Counting was performed over two to three somites. B, Representative pictures of targeted rostral and caudal sections, in brightfield (BF) and fluorescent (GFP) conditions for isl1:GFP and chx10:GFP fish in wholemount preparations, and for isl1:GFP fish in sagittal sections of the spinal cord. Scale bars represent 100 μm for wholemount images and 50 μm for section images. C, Count of GFP+ cells for the rostral and caudal section in chx10:GFP fish. D, Count of GFP+ cells for the rostral and caudal section in isl1:GFP fish. Counts in wholemount and sectioned fish were pooled together. E, Count of zn-8+ cells for the rostral and caudal section in isl1:GFP fish. Two-tailed paired Student’s t test (GFP+ in chx10:GFP rostral-caudal, p = 0.3196; GFP+ in isl1:GFP rostral-caudal, p = 0.0231; zn-8+ in isl1:GFP rostral-caudal, p = 0.7274); *p < 0.05, indicating significance. Gray circles are the average of three to four independent counts for each fish. Black circles are the average across all fish. Error bars display SD.

Expression Data

Expression Detail
Antibody Labeling
Phenotype Data

Phenotype Detail
Acknowledgments
This image is the copyrighted work of the attributed author or publisher, and ZFIN has permission only to display this image to its users. Additional permissions should be obtained from the applicable author or publisher of the image. Full text @ eNeuro