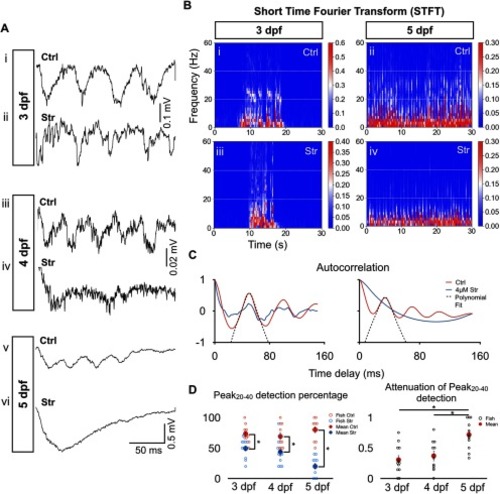
Greater effect of strychnine on tail beat rhythmicity at 5 dpf than at 3–4 dpf. A, Typical extracellular recordings of tail beats during single swimming episodes under control (Ctrl) and 4 μM strychnine (Str) conditions at 3 dpf (Ai, Aii), 4 dpf (Aiii, Aiv), and 5 dpf (Av, Avi). Arrowheads indicate examples of tail beats. Note the relative lack of tail beats at 4 and 5 dpf under strychnine condition (Aiv, Avi). B, Short-time Fourier transform (STFT) of a 30-s-long recording of spinal cord activity under control and 4 μM strychnine conditions at 3 dpf (Bi, Bii) and 5 dpf (Biii, Biv). White dotted lines mark the 20- to 40-Hz frequency range. We can see local maxima in the 20- to 40-Hz range for both 3-dpf plots and the control 5-dpf plot but not for the strychnine-positive 5-dpf plot. C, Example of the autocorrelation function of typical 3- and 5-dpf traces (left and right panel, respectively) under control condition (blue) and strychnine application (red). A polynomial fit (dashed line displays fit to the control trace) was performed to the values of the autocorrelation function within the 20- to 50-ms time delay range. Peak detection was performed to detect the presence of a peak in the polynomial fit within the 25- to 50-ms time delay range, which corresponds to the 20- to 40-Hz frequency range (see Materials and Methods). D, Left, Results from Peak20–40 detection algorithm for autocorrelation functions under control (blue) and strychnine (red) conditions. Data from somites 4–6 were pooled together. Right, Attenuation of Peak20–40 detection computed as 1 – (Peak20–40Strychnine/ Peak20–40Ctrl). N = 120 episodes (10 per fish, 12 fish) at 3 dpf, and N = 110 episodes (10 per fish, 11 fish) at each of 4 dpf and 5 dpf. Left, Two-tailed paired Student’s t test (at 3-dpf Ctrl-Str, p = 0.0014; at 4-dpf Ctrl-Str, p = 0.0029; and at 5-dpf Ctrl-Str, p = 3 × 10⁻⁵). Right, One-way ANOVA (F(2,31) = 16.69, p = 1 × 10⁻⁵) followed by two-tailed unpaired Student’s t test (3–4 dpf, p = 0.5283; 3–5 dpf, p = 0.0005; and 4–5 dpf, p = 0.0032); *p < 0.0166, which indicates significance following Bonferroni’s multiple-comparisons correction. Open circles represent the scores of each individual. Solid circles are the averages for every age and condition. Top horizontal bars display result of tests between the two groups at each end of the bars. Error bars display SEM.
|
