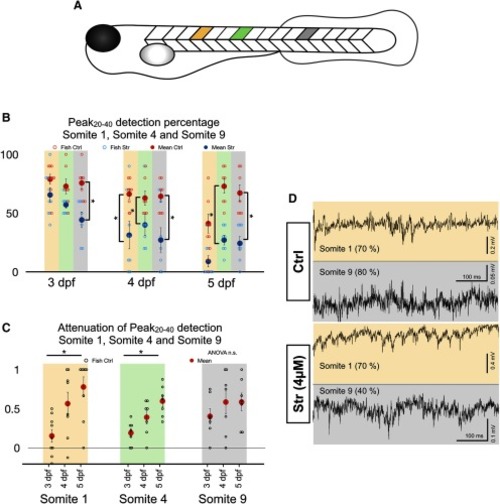
Differential effect of strychnine along the rostro-caudal axis of the zebrafish. A, Schematic of the position at which extracellular recordings were taken: somite 1 (gold), somite 4 (green), and somite 9 (gray). Somites were numbered from 1 to 9 such that somite 1 was the sixth somite rostral to the anus and somite 9 the third one caudal to the anus. B, Results from Peak20–40 detection algorithm for autocorrelation functions under control (blue) and strychnine (red) conditions for somites 1, 4, and 9. N = 10 episodes per fish in nine fish at every age for somites 1, 4, and 9. Two-tailed paired Student’s t test (3-dpf somite 1 Ctrl-Str, p = 0.0805; 3-dpf somite 4 Ctrl-Str, p = 0.0248; 3-dpf somite 9 Ctrl-Str, p = 0.0065; 4-dpf somite 1 Ctrl-Str, p = 0.0084; 4-dpf somite 4 Ctrl-Str, p = 0.0047; 4-dpf somite 9 Ctrl-Str, p = 0.0141; 5-dpf somite 1 Ctrl-Str, p = 0.0171; 5-dpf somite 4 Ctrl-Str, p = 0.0019; 5-dpf somite 9 Ctrl-Str, p = 0.0090). C, Attenuation of Peak20–40 detection computed as 1 – (Peak20–40Strychnine/Peak20–40Ctrl) for somites 1, 4, and 9. One-way ANOVA for each somite (somite 1, F(2,22) = 6.286, p = 0.0069; somite 4, F(2,18) = 7.674, p = 0.0039; somite 9, F(2,18) = 0.708; p = 0.5057) followed by two-tailed unpaired Student’s t test (somite 1 3–4 dpf, p = 0.0254; somite 1 3–5 dpf, p = 0.0017; and somite 1 4–5 dpf, p = 0.3772; somite 4 3–4 dpf, p = 0.0755; somite 4 3–5 dpf, p = 0.0010; and somite 4 4–5 dpf, p = 0.093). Top horizontal bars display result of tests between the two groups at each ends of the bars. D, Typical traces of dual recordings from somites 1 and 9 from the same fish (3 dpf) before and after strychnine application. Peak20–40 scores for each respective recording in parentheses; *p < 0.0166, indicating significance with Bonferroni’s multiple-comparisons correction. Open circles represent scores of each individual. Solid circles are the averages for every age and condition. Error bars display SEM.
|
