FIGURE

Figure 1.

ID
ZDB-FIG-200225-14
Publication
Roussel et al., 2020 - Spatiotemporal transition in the role of synaptic inhibition to the tail beat rhythm of developing larval zebrafish
Other Figures
All Figure Page
Back to All Figure Page
Figure 1.

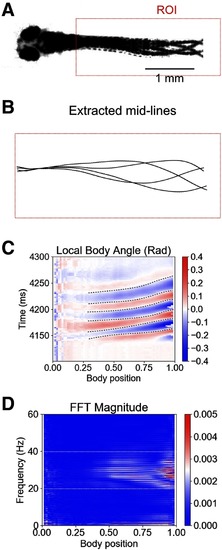
Larval zebrafish tail beat frequency during swimming is mainly between 20 and 40 Hz. A, Four superposed frames recorded during a single swimming episode of a 4-dpf larval fish. The red dotted box is the ROI in which the frame by frame analysis was performed. B, Examples of extracted midlines of the fish body over a swimming episode. C, Heat map of the local body angle amplitude. The fish body was divided into thirty segments from the caudal to the rostral end. The position of the body has been normalized such that the extreme caudal segment is 1.0, and the extreme rostral segment is 0.0. For every frame, the angle of each segment was computed and compared with the resting position. The resulting amplitude was assigned a color, blue for negative angles and red for positive angles. Black dotted lines are used to illustrate successive tail beats. D, For each body segment, a FFT was applied on a swimming episode and the result plotted as a heat map. Note that FFT outputs only positive values. The white dotted box highlights the 20- to 40-Hz range where the frequencies of tail beats reside.

Expression Data

Expression Detail
Antibody Labeling
Phenotype Data

Phenotype Detail
Acknowledgments
This image is the copyrighted work of the attributed author or publisher, and ZFIN has permission only to display this image to its users. Additional permissions should be obtained from the applicable author or publisher of the image. Full text @ eNeuro