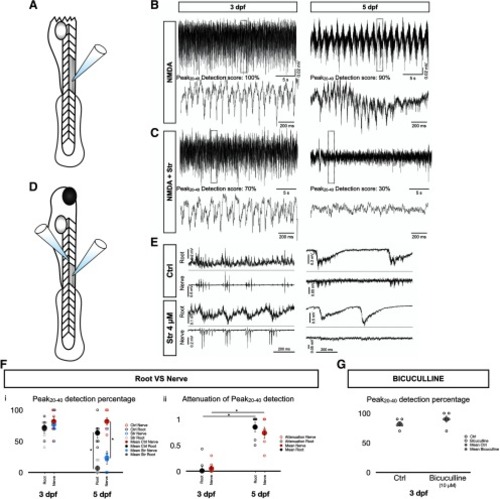
Transition to a SGDR driving tail beats observed in various conditions. A, Schematic of spinalized fish. Fish were cut at the junction between the hindbrain and the spinal cord. B, Upper traces. Typical NMDA induced fictive swimming recording from a 3 dpf (left) and 5 dpf (right) in spinalized fish. Lower traces are magnified views of the dotted boxed regions of the upper traces. C, Same as in B but after addition of 4 μM strychnine to the bath. D, Schematic of the paired ventral root and motor nerve setup. Muscles overlying somites 4–6 were removed. In this diagram, an electrode was attached to a ventral root from either somite 4 or 5 while another electrode was inserted in the muscle cleft of somite 3 to access the motor nerve. E, Representative traces of paired ventral root and motor nerve recordings under control (up) and strychnine (down) conditions for 3-dpf (left) and 5-dpf (right) zebrafish larvae. F, Peak20–40 detection scores (Fi) and attenuations of Peak20–40 detection (Fii) for the ventral root and motor nerve recordings in 3- and 5-dpf fish. Open circles represent the scores of each individual. Solid circles are the averages for every age and recording set-up. N = 6 fish; 10 episodes per fish. Error bars represent SEM. For Fi, two-tailed paired Student’s t test (3-dpf root Ctrl-Str, p = 0.8090; 3-dpf nerve Ctrl-Str, p = 0.4149; 5-dpf root Ctrl-Str, p = 0.0053; 5-dpf nerve Ctrl-Str, p = 0.0009). For Fii, two-tailed paired Student’s t test (3-dpf root–3-dpf nerve, p = 0.7093; 5-dpf root–5-dpf nerve, p = 0.4556) and two-tailed unpaired Student’s t test (3-dpf root–5-dpf root, p = 0.0007; 3-dpf nerve–5-dpf nerve, p = 0.0001); *p < 0.0125, which indicates significance following Bonferroni’s multiple-comparisons correction. G, Peak20–40 detection scores under control and bicuculline (10 μM) conditions in 3-dpf fish. Open circles represent the scores of each individual. Solid circles are the averages for every condition. N = 6 fish; 10 episodes per fish. Error bars represent SEM. Two-tailed paired Student’s t test, p = 0.3739.
|
