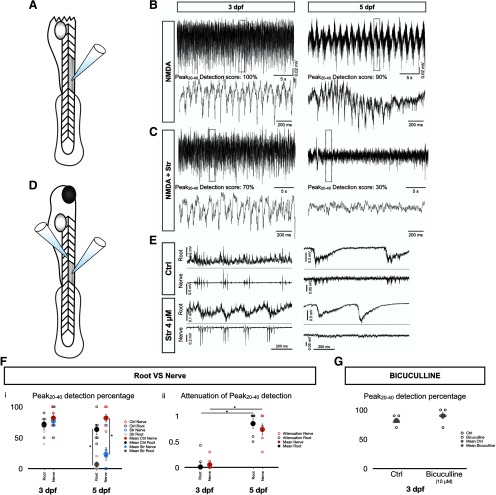
Transition to a SGDR driving tail beats observed in various conditions. A, Schematic of spinalized fish. Fish were cut at the junction between the hindbrain and the spinal cord. B, Upper traces. Typical NMDA induced fictive swimming recording from a 3 dpf (left) and 5 dpf (right) in spinalized fish. Lower traces are magnified views of the dotted boxed regions of the upper traces. C, Same as in B but after addition of 4 μM strychnine to the bath. D, Schematic of the paired ventral root and motor nerve setup. Muscles overlying somites 4–6 were removed. In this diagram, an electrode was attached to a ventral root from either somite 4 or 5 while another electrode was inserted in the muscle cleft of somite 3 to access the motor nerve. E, Representative traces of paired ventral root and motor nerve recordings under control (up) and strychnine (down) conditions for 3-dpf (left) and 5-dpf (right) zebrafish larvae. F, Peak20–40 detection scores (Fi) and attenuations of Peak20–40 detection (Fii) for the ventral root and motor nerve recordings in 3- and 5-dpf fish. Open circles represent the scores of each individual. Solid circles are the averages for every age and recording set-up. N = 6 fish; 10 episodes per fish. Error bars represent SEM. For Fi, two-tailed paired Student’s t test (3-dpf root Ctrl-Str, p = 0.8090; 3-dpf nerve Ctrl-Str, p = 0.4149; 5-dpf root Ctrl-Str, p = 0.0053; 5-dpf nerve Ctrl-Str, p = 0.0009). For Fii, two-tailed paired Student’s t test (3-dpf root–3-dpf nerve, p = 0.7093; 5-dpf root–5-dpf nerve, p = 0.4556) and two-tailed unpaired Student’s t test (3-dpf root–5-dpf root, p = 0.0007; 3-dpf nerve–5-dpf nerve, p = 0.0001); *p < 0.0125, which indicates significance following Bonferroni’s multiple-comparisons correction. G, Peak20–40 detection scores under control and bicuculline (10 μM) conditions in 3-dpf fish. Open circles represent the scores of each individual. Solid circles are the averages for every condition. N = 6 fish; 10 episodes per fish. Error bars represent SEM. Two-tailed paired Student’s t test, p = 0.3739.
Acknowledgments
This image is the copyrighted work of the attributed author or publisher, and
ZFIN has permission only to display this image to its users.
Additional permissions should be obtained from the applicable author or publisher of the image.
Full text @ eNeuro
Your Input Welcome
Thank you for submitting comments. Your input has been emailed to ZFIN curators who may contact you if
additional information is required.
Oops. Something went wrong. Please try again later.