|
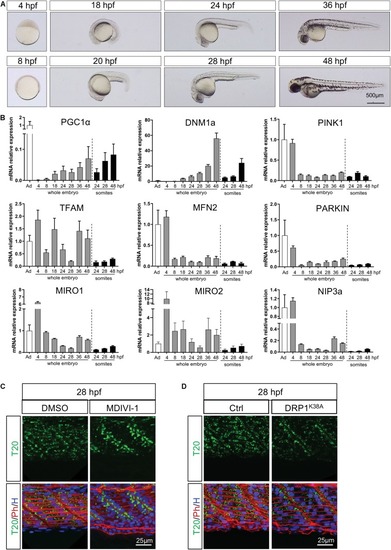
Temporal configuration of mitochondrial biogenesis, fusion, fission, mitophagy and transport through embryogenesis. (A) Representative pictures illustrate the different stages of zebrafish development used for quantitative RT-PCR. (B) Gene expression of key mitochondrial actors in whole embryos or dissected somites. Values are estimated using the 2–ΔΔCT method. Gene expression is normalized to 18S and compared to adult zebrafish muscle (bars are mean ± SEM). (C) Confocal imaging of mitochondrial network (Tomm20, T20; green) counterstained with Phalloidin (Ph; red) and Hoescht (H; blue) at 28 hpf in presence or absence of the fission inhibitor MDIVI-1 incubated since 24 hpf. (D) Confocal imaging of mitochondrial network (Tomm20, T20; green) counterstained with Phalloidin (Ph; red) and Hoescht (H; blue) at 28 hpf in embryos injected with mRNA encoding for the dominant negative DRP1 or with a mock at the one-cell stage zygote.
|