FIGURE

FIGURE 2

ID
ZDB-FIG-191230-1178
Publication
Arribat et al., 2019 - Mitochondria in Embryogenesis: An Organellogenesis Perspective
Other Figures
All Figure Page
Back to All Figure Page
FIGURE 2

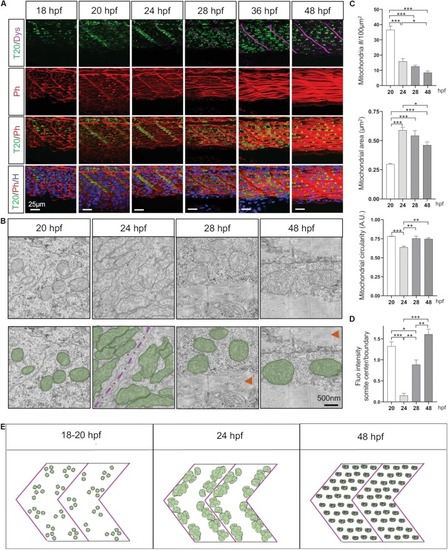
Mitochondria network adaptation follows three patterns of change through embryogenesis. (A) Confocal imaging of mitochondrial network (Tomm20, T20; green) counterstained with Phalloidin (Ph; red), Dystrophin (Dys; Magenta) and Hoescht (H; blue) at 18, 20, 24, 28, 36, and 48 hpf. Pictures taken at the limit of yolk extension (somites 15–17). (B) Electron micrographs of longitudinal sections at 20, 24, 28, and 48 hpf. Green overlays highlight mitochondria, red arrows indicate sarcomeric structures, magenta line is the separation between two somites. (C) Quantitative analyses of mitochondrial number, area and circularity at 20, 24, 28, and 48 hpf (n = 6 micrograph areas of 200 × 200 μm2 analyzed per group). (D) Quantification of Tomm20-zsGreen fluorescence ratio between somite center and boundary region at 20, 24, 28, and 48 hpf (n = 6 fish per group, 3 images analyzed per fish). (E) Cartoon depicts three distinct patterns presented by the mitochondrial network through embryogenesis. Bars are mean ± SEM. P < 0.05, ∗∗P < 0.01, ∗∗∗P < 0.001, one way repeated measures ANOVA with Tukey HSD post hoc test. See also Supplementary Figures S2S5 and Supplementary Video S1.

Expression Data
Gene:
Fish:
Anatomical Term:
Stage Range: 14-19 somites to Long-pec

Expression Detail
Antibody Labeling
Phenotype Data

Phenotype Detail
Acknowledgments
This image is the copyrighted work of the attributed author or publisher, and ZFIN has permission only to display this image to its users. Additional permissions should be obtained from the applicable author or publisher of the image. Full text @ Front Cell Dev Biol