
Fig. S5
- ID
- ZDB-FIG-191003-2
- Publication
- Xue et al., 2019 - A 3D Atlas of Hematopoietic Stem and Progenitor Cell Expansion by Multi-dimensional RNA-Seq Analysis
- Other Figures
- All Figure Page
- Back to All Figure Page
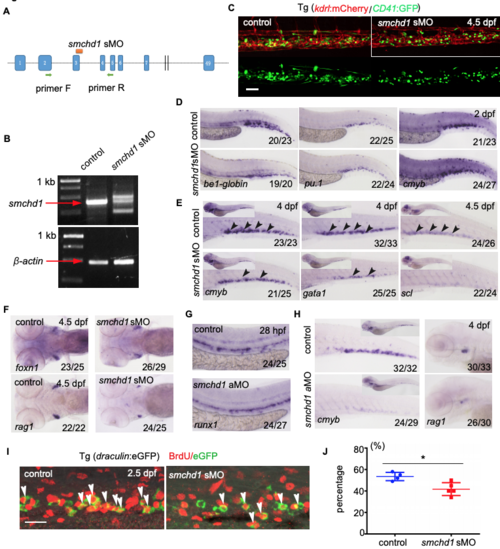
The hematopoietic deficiency in smchd1 morphants, related to figure 3. A The illustration of smchd1 splice morpholino (sMO) target site which is located between exon 3 and intron 3. B. The smchd1 sMO validation by RT-PCR. The agarose gel imaging showing the abnormal spliced transcripts in sMO injected embryos compared with control, B-actin used as control. C. Confocal imaging of the transgenic line (kdrl;mCherry/CD41:GFP) showing the number of CD41 cells in control and smchd1 sMO injected embryos at 4.5 dpf. n=4 D. WISH showing the expression of bel-globin, pu. 1 and cmyb at 2 dpf in control and smchd1 sMO injected embryos. E. WISH showing the expression of cmyb, gatal and scl at 4dpf in control and smchd1 sMO injected embryos. F. WISH showing the expression of rag1 and foxn1 at 4.5 dpf in control and smchd1 sMO injected embryos. G. WISH showing the expression of runx1 at 28 hpf in control and smchd1 ATG morpholino (aMO) injected embryos. H. WISH showing the expression of cmyb and rag1 in control and smchd1 aMO injected embryos at 4 dpf. I. The double staining image of anti-BrdU antibody and eGFP FISH in control and smchd1 morphants at 2.5 dpf. White arrowheads indicate draculin+BrdU+ double positive cells. J. The statistical data show the percentage of draculin+BrdU+/draculin+ cells in (I). n(control)=4, n(smchd1)=5. Data are shown as means +- SEM. *P<0.05 |
| Genes: | |
|---|---|
| Fish: | |
| Knockdown Reagents: | |
| Anatomical Terms: | |
| Stage Range: | Prim-5 to Day 4 |
| Fish: | |
|---|---|
| Knockdown Reagents: | |
| Observed In: | |
| Stage Range: | Pec-fin to Day 4 |