
Fig. S2
- ID
- ZDB-FIG-190802-3
- Publication
- Xue et al., 2019 - A 3D Atlas of Hematopoietic Stem and Progenitor Cell Expansion by Multi-dimensional RNA-Seq Analysis
- Other Figures
- All Figure Page
- Back to All Figure Page
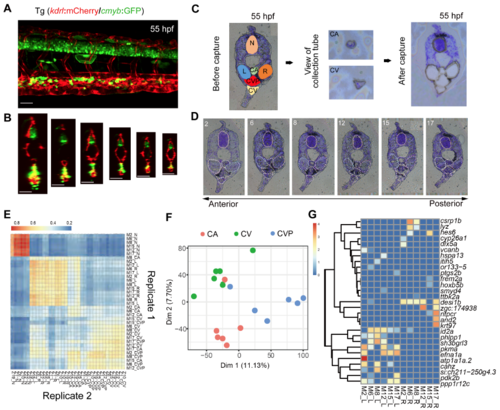
The overview and validation of GEO-seq A. The confocal imaging of 55 hpf CHT region of the transgenic line (kdrl:mCherry/cmyb:GFP) embryo. B. The transversal views of the zebrafish CHT region are displayed by Imaris software. C. The imaging showing the GEO-seq process including the locations of distinct samples on one section, and the achievement of sample collection after Lazer Capture Microdissection (LCM). D. The six sections of 55 hpf CHT from anterior region to posterior region covering about 400 um. E. Heatmap showing a high correlation between corresponding regions of two GEO-seq replicates. F. PCA of samples from caudal artery (CA), caudal vein (CV) and caudal vain plexus (CVP). G. DEGs identified between left muscle (L) and right muscle (R) samples showing no signifigant difference of gene expression between left muscle and right muscle regions. |