
Fig. S4
- ID
- ZDB-IMAGE-180817-12
- Publication
- Mahony et al., 2018 - Oncostatin M and Kit-Ligand Control Hematopoietic Stem Cell Fate during Zebrafish Embryogenesis
- All Figures
- Figures for Mahony et al., 2018
|
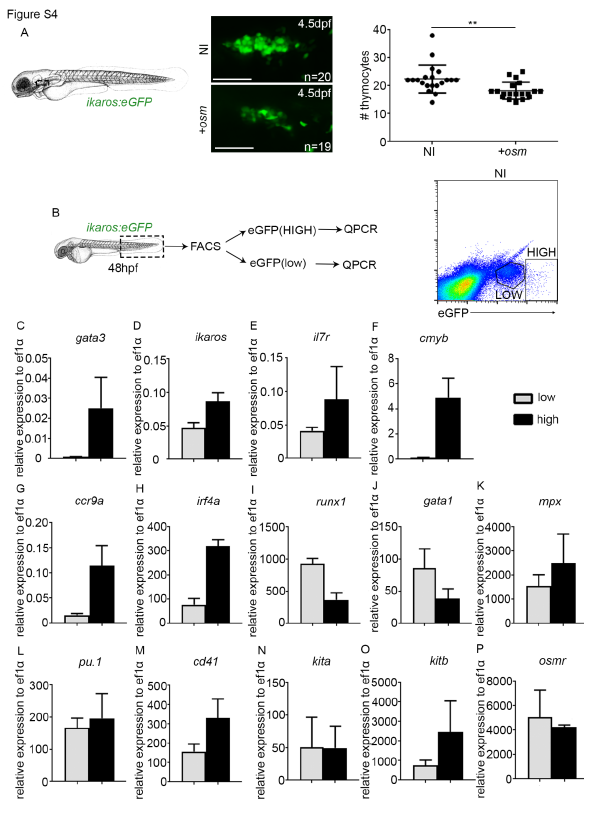
Fig. S4
Characterisation of ikaroshigh and ikaroslow population. (A) Thymus imaging in ikaros:eGFP 4.5dpf embryos. P=0.0031. Scale, 50μm. NI, non-injected control. +osm, osm full length mRNA injected embryos. (B) FACS sorting of ikaros:eGFPlow and ikaros:eGFPhigh cells at 48hpf from non-injected embryos. (C-P) qPCR analysis of gene expression in the low and high population. Data represented is mean±SD from biological triplicates, except in runx1, gata1 and osmr ikaros:eGFPhigh where data is biological duplicates. Statistical analysis was completed using an unpaired, two-tailed Student's t-test. ** p<0.01.