
Fig. 5
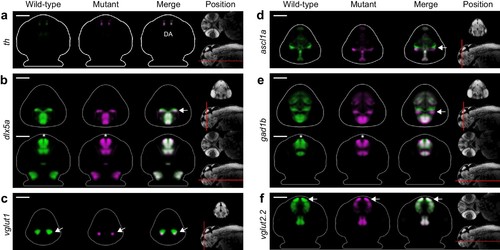
Fezf2 mutants exhibit telencephalic glutamatergic deficits during early development. (A–F) Overlay analysis of in situ expression patterns in wild-type and fezf2 mutant embryos at 2 dpf. Wild-type expression patterns are shown in green and fezf2 mutants are shown in magenta. (A) Expression of th is largely unaffected in dopaminergic (DA) clusters of the telencephalon. (B) Expression of the GABAergic marker dlx5a is shifted ventrally in the diencephalon (arrow) and is away from the midline in the telencephalon (asterisk), but is not significantly reduced. (C) Expression of the glutamatergic marker vglut1 is substantially reduced in the telencephalon (arrow). (D) Expression of the progenitor marker ascl1a is shifted ventrally (arrow) and compressed along the dorsoventral axis of the telencephalic midline. (E) Expression of the GABAergic marker gad1b is shifted ventrally in the diencephalon (arrow) and is away from the midline in the telencephalon (asterisk), but is not significantly reduced. (F) Expression of the glutamatergic marker vglut2.2 is substantially reduced in the telencephalon (arrow). (A–F) The position and orientation of each 2D slice within the embryo is indicated on the Nissl-stained two photon reference image to the right of the panel. For frontal sections anterior is to the top; for transverse sections dorsal is to the top. Scale bar: 100 μm. |