
Fig. 1
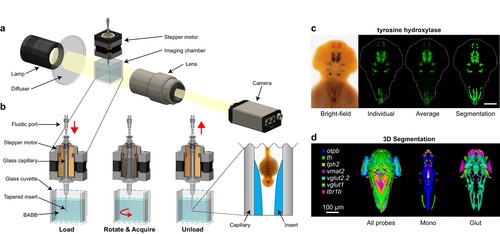
Automated OPT platform for automated 3D in situ phenotyping. (A) From left to right, the optical projection tomography platform consists of the following components: (1) a post-mountable broadband emission quartz tungsten-halogen light source, (2) a ground glass diffuser, (3) an imaging chamber and glass capillary capable of rotating the specimen 360°, (4) a telephoto zoom lens, and (5) a programmable progressive scan CCD camera (one megapixel, 120 fps). (B) The imaging chamber consists of an upper hollow shaft stepper motor run by 5-phase microstepping drivers and a lower transparent glass cuvette. The stepper motor holds and rotates an aluminosilicate glass capillary containing a non-embedded, paraformaldehyde-fixed zebrafish embryo stained using standard chromogenic whole-mount in situ hybridization techniques. Both the capillary and the surrounding glass cuvette are filled with benzyl alcohol-benzyl benzoate (BABB) to achieve refractive index matching and render the fixed sample optically transparent. The bottom end of the capillary contains a tapered insert fabricated from index-matching optical adhesive to hold the sample in place during rotational imaging and enable rapid loading and unloading through the upper fluidic port. The location and movement of the embryo during each step is indicated by the red arrow. (C) Tomographic reconstruction of a 2 dpf embryo stained with tyrosine hydroxylase showing from left to right: a typical single 2D bright-field image, a 3D reconstruction of an individual embryo presented as a maximum intensity projection, an averaged 3D expression pattern based on 10 embryos, and a 3D segmentation of the averaged pattern. (D) Co-registered 3D segmentations of all probes in our library (left), monoaminergic markers (mono, center), and glutamatergic markers (glut, right). (C,D) Anterior is to the top. Scale bar: 100 μm. |