
Fig. 6S1
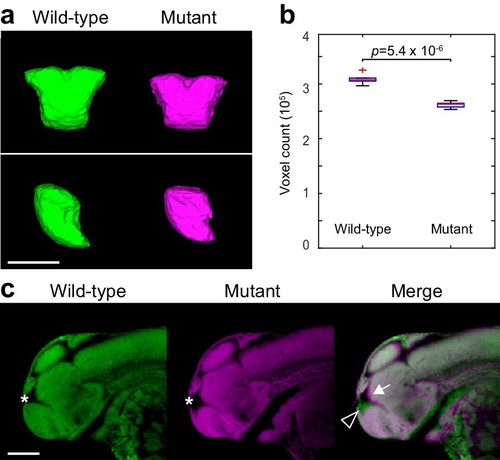
Two-photon analysis of telencephalon morphology. (A) 3D segmentations of the telencephalon in 2 dpf Nissl-stained embryos. Six wild-type and six fezf2 mutant embryos from the same clutch were imaged using two-photon excitation microscopy and segmented manually based on anatomical landmarks. Averaged 3D segmentations are shown in front (top) and side (bottom) view. Dorsal is to the top. (B) Box-and-whisker plots showing results of volume measurements from 3D segmentations. Tops and bottoms of each box represent the 25th and 75th percentiles of the samples, respectively. Whiskers are drawn from the ends of the interquartile ranges to the furthest observations within the whisker length. The line in the middle of each box is the sample median. Observations beyond the whisker length are marked as outliers (+ sign). Statistical significance was determined by two-tailed t-test. Volume measurements used for box-and-whisker plots are available in Figure 6—source data 1. (C) Sagittal slices through averaged 3D reconstructions of Nissl-stained embryos showing reduced telencephalon volume (open arrowhead), enlarged ventricle (*), and concomitant anterior/ventral shift of the adjoining dorsal diencephalic regions (arrow). Anterior is to the left, dorsal is to the top. Scale bar: 100 μm. |