
Fig. 3
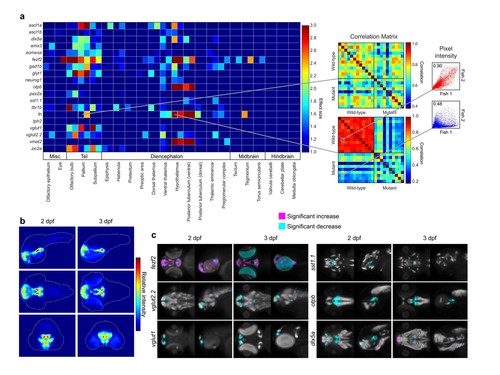
Automated detection and statistical quantification of fezf2 mutant deficits. (A) Right: alterations in the expression of individual probes can be" "detected using a correlation-significance analysis approach. For each brain region, all wild-type embryos are compared with each other and with all mutant embryos, creating a correlation matrix. The Pearson correlation coefficient is calculated for each embryo pair based on the intensities of corresponding voxels. For probes with altered expression patterns in fezf2 mutants, correlation within groups (i.e. wild-type vs. wild-type and mutant vs. mutant) is significantly greater than correlation between groups. Scatterplots to the right of the correlation matrix illustrate embryo pairs with correlated (red; r = 0.9) and uncorrelated (blue; r = 0.5) expression. Left: Automated Correlation Analysis plot showing results for all in situ probes in all brain regions at 2 and 3 dpf. For each region, 2 dpf results are shown in the left square and 3 dpf in the right. Dark blue squares indicate no significant" "-5" "difference between wild-type and mutant embryos (p<10 ). For regions with a significant difference, the color bar represents the effect size (d > 1) of" "the difference. (B) Regions in which the expression patterns of multiple independent probes have been altered can be visualized using aggregate difference imaging. Pixel intensity difference is calculated between wild-types and mutants for each probe within each affected brain region. Summing the absolute value of the significant differences for all probes highlights areas which are most altered in fezf2 mutants. Aggregate difference images are shown at 2 and 3 dpf in lateral (upper panels), dorsal (middle panels), and anterior (lower panels) views. Telencephalon, t; ventral diencephalon, vd. (C) Significance analysis overlaid on maximum Intensity Projections (MIPs). MIPs have been color coded to highlight all regions in which the expression of a" "-3" "given probe is significantly reduced (cyan) or increased (magenta) in mutant embryos (p<0.5x10 ). Significant intensity differences between mutants" "and wild-types were determined by performing a Mann-Whitney U-test to compare corresponding voxels for each probe within each brain region showing alterations in Automated Correlation Analysis. All MIPs show dorsal (left) and lateral (right) views. (B,C) Anterior is to the left, dorsal is to the" "top." |