
Fig. 3S4
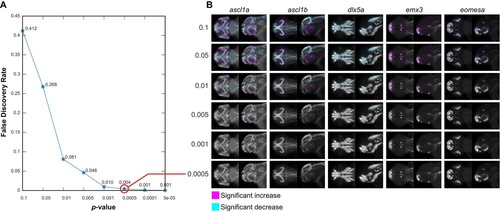
Negative controls for maximum intensity projections. (A) The null data set from Figure 3—figure supplement 3A is used to define the false discovery rate (FDR) for significance analysis of maximum intensity projections (MIPs) over a range of p-value thresholds. We perform a Mann-Whitney U test to compare corresponding voxels between the two negative control groups for each probe within each brain region that shows alterations based on Automated Correlation Analysis of the fezf2 mutant (Figure 3—figure supplement 3B). We then evaluate significance thresholds (t) ranging from p=0.1 to 5e-05 by counting the number of experimental scores (sexp; wild-types vs. fezf2 mutants) ≥ t and the number of null scores (snull; negative control group one vs. negative control group 2) ≥ t and calculating the FDR (snull/sexp). Both experimental and null data sets comprise 1,962,771 scores (i.e. the total number of voxels in all brain regions that are significantly altered in fezf2 mutants for each of the 19 in situ probes). Based on this analysis, we chose p<0.5×10⁻³ (red circle; FDR = 0.004) as an appropriate threshold for voxelwise analysis. (B) MIPs for the first five in situ probes in our library have been color coded to highlight voxels in which expression is significantly reduced (cyan) or increased (magenta) between the two negative control groups at the indicated threshold. Note that at the threshold chosen for voxelwise analysis of experimental data (p<0.5×10⁻³), virtually no significant voxels are visible by eye. All MIPs show dorsal (left) and lateral (right) views. Anterior is to the left, dorsal is to the top. |