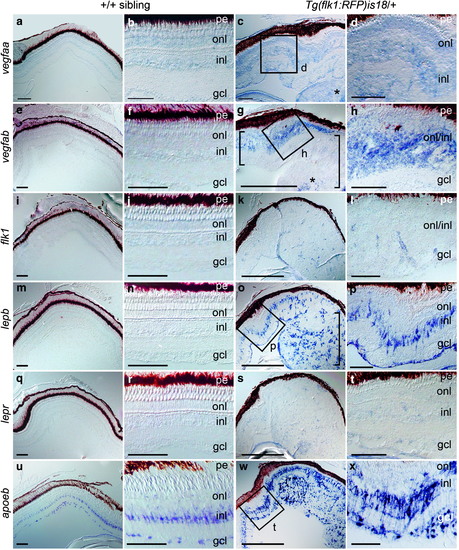
Induction of vegfab and lepb expression in distinct cell populations in Tg(flk1:RFP)is18 dysplastic retina and retinal tumor. In situ hybridization of retina cryosections from +/+ (a, b, e, f, i, j, m, n, q, r, u, v) and Tg(flk1:RFP)is18 (c, d, g, h, k, l, o, p, s, t, w, x) adult siblings. Weak expression of vegfaa is detected in the three nuclear layers of the retina (a, b) and in early dysplastic (c [box], d) and retinal tumor tissue (c, asterisk). Expression of vegfab (e, f), the VEGF receptor flk1 (i, j), lepb (m, n), or the Leptin receptor lepr (q, r) is not detected in wild-type +/+ retina. (g, h) In early dysplastic retina vegfab is detected throughout the inner and outer nuclear layers (g [small bracket], h). In the tumor containing region (large bracket) vegfab is detected in a central region of the lesion (asterisk). (k, l) The VEGF receptor flk1 was present in small groups of cells scattered throughout the tissue that may overlap with microvessels. (o, p) lepb is highly expressed in a subset of cells in the inner nuclear layer and cells in the ganglion cell layer in dysplastic retina and present in many cells evenly distributed in the early tumor (bracket). (s, t) The lepr receptor expression is faint and diffuse in dysplastic retina and tumor tissue. (u, v) In wild-type retina the glial marker apoeb is strongly expressed in inner nuclear layer Müller glia and astrocytes in the ganglion cell layer/nerve fiber layer. (w, x) apoeb expression is highly elevated in dysplastic retina and is detected in projections crossing the inner plexiform layer. Numerous cells throughout the tumor tissue labeled intensely with apoeb. gcl, ganglion cell layer; inl, inner nuclear layer; onl, outer nuclear layer; pe, pigmented epithelium. All scale bars, 100 μm, except panels (g, k, o, s, t) scale bars, 500 μm.
|
