
Fig. 2
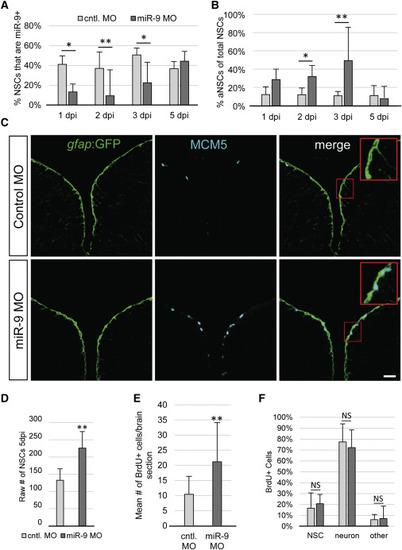
miR-9 Maintains NSC Quiescence (A) Percentage of NSCs expressing miR-9 at 1, 2, 3, and 5 days post injection (dpi) of the control vivoMO (light gray bars) or miR-9 vivoMO (dark gray bars). (B) Percentage of aNSCs (MCM5+, gfap) over the total NSCs population (gfap+) 1, 2, 3, and 5 dpi of the control vivoMO (light gray bars) or miR-9 vivoMO (dark gray bars). (C) Double immunostaining for gfap:GFP (green) and MCM5 (light blue) in control (top) and miR-9 (bottom) vivoMO-injected brains. Scale bar, 20 μm. (D) Average raw number of gfap+ NSCs per section in control (light gray bar) and miR-9 (dark gray bar) vivoMO-treated brains at 5 dpi. (E and F) Analysis of the fate of activated cells upon miR-9 kd. Fish were administered BrdU for 48 hr following injection of vivoMOs and analyzed after 30 days of chase. (E) Mean number of BrdU+ per brain section in control (light gray bar) and miR-9 (dark gray bar) vivoMO-treated brains. (F) Percentage of BrdU+ cells that remain NSCs (gfap+), or acquired a neuronal fate (HuC/D+) or other fate in control (light gray bar) and miR-9 (dark gray bar) vivoMO and brains after a 30 day chase. ∗p < 0.05, ∗∗p < 0.01; one-way ANOVA with Bonferroni post hoc correction. Data are represented as mean ± 95% CI; n = 3 brains per condition. |
| Genes: | |
|---|---|
| Antibody: | |
| Fish: | |
| Knockdown Reagent: | |
| Anatomical Terms: | |
| Stage: | Adult |
| Fish: | |
|---|---|
| Knockdown Reagent: | |
| Observed In: | |
| Stage: | Adult |