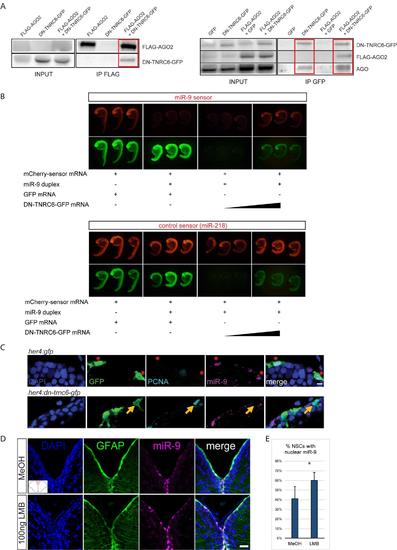
Fig. S6
|
Validation of the DN-TNRC6 construct and effect of DN-TNRC6 and LMB on miR-9, related to figure 5 (A) Co-immunoprecipitation experiments between DN-TNRC6-GFP and AGO proteins. Zebrafish embryos were injected with combinations of GFP-, FLAG-AGO2- or DN-TNRC6-GFP-encoding capped mRNA and subjected to immunoprecipitation with anti- FLAG beads (left panel) or anti-GFP beads (right panels). Input samples (1/10) and co-immunoprecipitated samples were then subjected to Western blot with antibodies for GFP, FLAG or AGO. DN-TNRC6-GFP co-immunoprecipitates with FLAG-AGO2 (right panel), and both FLAG-AGO2 and endogenous AGO proteins can be co-immunoprecipitated with DN-TNRC6-GFP (left panels). (B) miR-9 sensor assays in the presence of DN-TNRC6-GFP. mCherry sensor mRNAs harbouring binding sites for miR-9 (top panel) or miR-218 (bottom panel) were injected in zebrafish eggs together with miR-9 duplexes, GFP mRNA or DN-TNRC6-GFP mRNA at increasing doses. Embryos were imaged at 24hpf and a picture of 3 representative embryos is shown for each condition. miR-9 duplexes efficiently silence miR-9 sensor expression, while having no effect on the control miR-218 sensor. High doses of DN-TNRC6-GFP mRNA induce a specific rescue of miR-9-induced silencing of the miR-9 sensor. (C) ISH for miR-9 (magenta) and double immunofluorescence of GFP (green) and PCNA (light blue) with nuclear DAPI counterstaining (dark blue) demonstrating that cells electroporated with the DNTNRC6 construct (bottom panel) never display nuclear miR-9 and enter more frequently into cell cycle as shown by expression of PCNA (yellow arrow) when compared to cells that are electroporated with the control construct (top panel) which do display miR-9 in the nucleus (red asterisks). Scale bar=5μm. (D) ISH with miR-9 LNA probe (magenta) with fluorescent immunostaining of gfap:GFP (green) and DAPI nuclear counterstaining (dark blue) after ventricular injection of LMB (bottom panel) or a MeOH control (top panel). A noticeable increase in the number of cells with high miR-9 nuclear staining is observed. Scale Bar=20μm (E) Quantifications of the experiment shown in D showing the percentage of NSCs with nuclear miR-9 staining after MeOH or LMB intraventricular injections. n=3 brains per condition; data are represented as mean ± 95% CI. (**) p<0.01; one-way ANOVA with Bonferroni post-hoc correction. |

