
Fig. 5
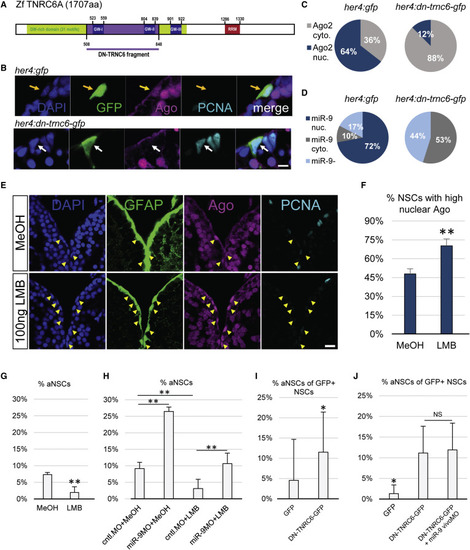
Active Nucleo-Cytoplasmic Shuttling of Ago and miR-9 Impacts the Quiescent State of NSCs (A) Scheme of the zebrafish TNRC6 protein with the cloned GW-rich Ago binding domain highlighted in purple. (B) Triple immunofluorescence of GFP (green), Ago (magenta), and PCNA (light blue) with nuclear DAPI counterstaining (dark blue) on a representative cell electroporated with a control construct (her4:gfp, top, yellow arrow) or the dominant-negative TNRC6 (DN-TNRC6) construct (her4:dn-tnrc6a-gfp, bottom, white arrow). Scale bar, 5 μm. (C) Quantification of the data from (B), showing the percentage of electroporated cells with mostly nuclear (blue) or cytoplasmic (gray) Ago signal; n = 10 brains per condition. (D) Percentage of cells electroporated with the her4:gfp (top) or her4:dn-tnrc6-gfp construct (bottom) in which miR-9 is detected in the nucleus (dark blue), cytoplasm (gray) or absent (light blue); n = 10 brains per condition. (E) Triple fluorescent immunostaining of gfap:GFP (green), Ago (magenta), and PCNA (light blue) with nuclear DAPI counterstaining (dark blue) after ventricular injection of LMB (bottom) or a MeOH control (top). Yellow arrowheads highlight NSCs with a strong nuclear Ago signal. Scale bar, 20 μm. (F and G) Quantification of data from (E) 24 hpi with LMB or MeOH as a control; n = 5 brains per condition. (F) Percentage of NSCs (gfap+) with strong nuclear Ago signal. (G) Percentage of aNSCs (PCNA+, gfap+) among NSCs (gfap+). (H) Percentage of aNSCs (PCNA+, gfap+) among NSCs (gfap+) upon combination of LMB or MeOH injections with vivoMO injections. n = 4 brains per condition. (I) Quantification of the data from (B) of the percentage of GFP+ aNSCs out of total GFP+ NSCs; n = 10 brains per condition. (J) Percentage of aNSCs (MCM2+, GFP+) out of total NSCs (GFP+) after electroporation with the control her4:gfp or her4:dn-tnrc6-gfp construct and subsequent MO injections. n = 7 brains per condition. ∗p < 0.05, ∗∗p < 0.01; one-way ANOVA with Bonferroni post hoc correction. Data are represented as mean ± 95% CI. |