
Fig. S4
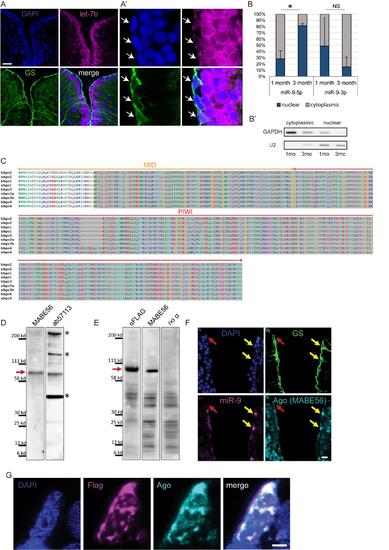
Confirmation of specific subcellular localization of miR-9 and validation of Ago antibodies (ab57113 and MABE56), related to figure 4 (A-A') ISH using LNA probe for let-7b (magenta) combined with immunostaining for GS (green) and DAPI counterstaining (dark blue). In the zebrafish pallium let-7b expression is localized to the first ventricular raws of cells (A); in NSCs (white arrows) let-7b ISH signal is restricted to the cytoplasm (A’). Scale bars=50μm (A) and 5μm (A’) (B-B’) RT-qPCR analysis of miR-9 levels in fractionated RNA samples. (B) Nucleo-cytoplasmic ratio of miR-9 and miR-9-3p levels based on qPCR analysis on fractionated samples from the juvenile (1 month-old) and adult (3 months-old) zebrafish telencephalon. n=2 biological replicates per sample; data are represented as mean ± SEM. (*) p<0.05; t-tailed t-test after arcsin transformation. (B’) Control of the purity of the cytoplasmic and nuclear fractions by PCR using GAPDH and U2 specific primers. (C) Alignment of MID and PIWI domains of Argonaute proteins from human and zebrafish. In these regions Ago proteins (1-4) sequences are highly conserved between human and zebrafish. The Ago antibody ab57113 was raised against a highly conserved portion of the C-terminal region of human Ago2 spanning the PIWI and part of the MID domains (residues 483-859; highlighted in grey). The second Ago antibody (pan-Ago MABE56) was raised against human Ago2 residues 47-859, and the epitope located to the C-terminal region. (D) Western blot analysis of adult telencephalic extracts using the two different Ago antibodies (MABE56, exposure time=5 min; ab57113, exposure time=2 min.). Red arrow indicates that both antibodies detect the Ago specific band at ~96 kd (blue asterisks indicate non-specific bands). (E) Western blot analysis of protein extracts from embryos injected with Flag-tagged zebrafish Ago2 using an anti-Flag antibody (exposure time=1 min.), Ago antibody (MABE56, exposure time=5 min.) and a no primary antibody control showing non-specific bands (exposure time=2 min.). Red arrow indicates the specific Ago band at ~96 kd detected by both the anti-Flag and anti-Ago antibodies. (F) ISH for miR-9 (magenta) and double immunofluorescence of GS (green) and Ago (MABE56, light blue) with nuclear DAPI counterstaining (dark blue). As with the ab57113 anti-Ago antibody (Figure 4D), the signal for Ago is nuclear only in the miR-9+ NSCs (yellow arrows) and not in the miR-9- NSCs (red arrow), thus validating the specific detection of Ago proteins using these antibodies. Scale bar=20μm. (G) Representative picture of a ventricular NSC electroporated with Ago2-Flag. Double immunofluorescence of Flag (magenta) and Ago (ab57113, light blue) with nuclear DAPI counterstain (dark blue) demonstrates that the expression of Ago as detected by the Ago antibody overlaps with the expression of the Flag-tagged Ago2 further validating the specificity of the Ago antibody. Notably, Ago2-Flag foci are detected in the nucleus of the electroporated cell. Scale bar=2μm. |