
Fig. 7
- ID
- ZDB-FIG-150415-22
- Publication
- Takamiya et al., 2015 - Molecular Description of Eye Defects in the Zebrafish Pax6b Mutant, sunrise, Reveals a Pax6b-Dependent Genetic Network in the Developing Anterior Chamber
- Other Figures
- All Figure Page
- Back to All Figure Page
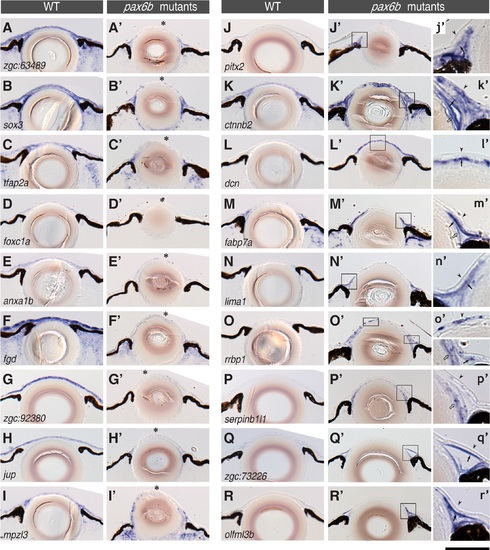
Gene expression in the cornea is severely affected in pax6b mutants. The distribution of the mRNA of cornea genes was compared at 7 dpf between wildtype (A-R) and pax6b mutant embryos (A′-R′). Each panel represents a transverse section through the eye and the lens. The gene transcripts analysed by in situ hybridization are zgc:63489 (A-A′), sox3 (B-B′), tfap2a (C-C′), foxc1a (D-D′), anxa1b (E-E′), fgd (F-F′), zgc:92380 (G-G′), jup (H-H′), mpzl3 (I-I′), pitx2 (J-J′), ctnnb2 (K-K′), dcn (L-L′), fabp7a (M-M′), lima1 (N-N′), rrbp1 (O-O′), serpinb1l1 (P-P′), zgc:73226 (Q-Q′) and olfml3b (R-R′). (A-I′) Examples for the loss of gene expression in the pax6b mutant (asterisks). (J-R′) Genes whose expression is ectopically induced in the pax6b mutant. The insets (j′-r′) represent magnified views of corresponding cornea regions (rectangular areas in J′-R′); arrowheads, filled arrows and open arrows indicate the corneal epithelium, the endothelium and the lens epithelium. The ectopic expression in pax6b mutants was mostly observed in the endothelial layer or in the iridocorneal angle. In contrast, the loss of gene expression in the pax6b mutant was mostly detected in the epithelial layer (asterisks in A-I). Scale bar: 64 µm (A-R′) and 20 µm (j′-r′). |
| Genes: | |
|---|---|
| Fish: | |
| Anatomical Terms: | |
| Stage: | Days 7-13 |