FIGURE

Fig. 4

ID
ZDB-FIG-121210-33
Publication
Wu et al., 2012 - Chemokine GPCR Signaling Inhibits β-Catenin during Zebrafish Axis Formation
Other Figures
All Figure Page
Back to All Figure Page
Fig. 4

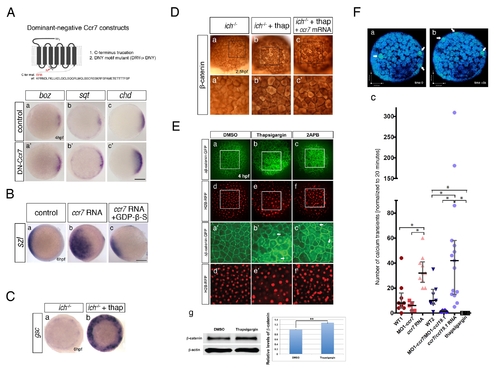
Ccr7 functions as a GPCR and promotes calcium signaling.

(A) Misexpression of two dominant-negative Ccr7 mutant forms promotes organizer gene expression. Top panel, a schema of the mutant forms employed: DN1, C-terminal truncation, and DN2, DRY→DNY mutant. Bottom panel shows effects of injecting 100 pg DN2-ccr7 RNA on boz (a2, n = 14/18) and sqt (b2, n = 11/15), and of DN1-ccr7 RNA on chd (c2, n = 13/20) expression compared to uninjected control embryos (a–c) at sphere stage, 4 hpf. Animal views, dorsal to the right. (B) Expression of szl in control embryos (a, n = 8/8) was expanded in ccr7 RNA injected WT embryos (b, 150 pg, n = 14/14), and suppressed by co-injection of GDP-β-S (~300 nM) at shield stage (c, n = 12/15, two experiments). Animal views, dorsal to the right. (C) gsc expression in control (a) and thapsigargin-treated ich mutants (b; 4 µM; n = 20/20) at shield stage, 6 hpf. Animal views, dorsal to the right. (D) β-catenin immunostaining in control (a, a2), thapsigargin-treated ich mutants (b, b2 4 µM; n = 6/6), and thapsigargin-treated ich mutants injected with ccr7 RNA (c, c2 n = 5/6). (a2–c2) Higher magnification images of the boxed areas in a–c. (E) Thapsigargin (b, b2) and 2-APB-treated WT embryos (c, c2) showed increased level and nuclear ΔNβ-catenin-GFP signal, compared to control embryos (a, a2). H2B-RFP RNA was injected as nuclear background control (d, d3, e, e2, c, c2). (d) Western blot for total β-catenin and actin in control (DMSO-treated) and thapsigargin-treated (4 μM) WT embryos at 4 hpf, with relative quantification to β-actin from three independent experiments in the right panel. (F) Effects of ccr7 and thapsigargin on Ca2+ transients in superficial blastomeres. (a, b) Examples of Ca2+ transients revealed by in vivo ratiometric image analysis in a WT embryo at 512-cell stage. The arrows point out the Ca2+ transients at consecutive time points (still images). Note the rapid changes of Ca2+intensity (compare b to a, 8 s interval). (c) The number of Ca2+ transients normalized to 20 min in control embryos (WT1, n = 9, red; WT2, n = 7, blue), ccr7 morphants (n = 5), Ccr7 overexpressing blastulae (n = 10), ccr7/ccl19.1 double morphants (20 ng/2 ng; n = 8), and Ccr7/Ccl19.1 overexpressing (200 pg/200 pg RNA; n = 15), and thapsigargin-treated (n = 4) blastulae were quantified by in vivo time-lapse imaging with Calcium Green-1 at about 256-cell stage or 2.5 hpf (see Materials and Methods for detail). Red and blue data were collected over 10 and 20 min, respectively; * p<0.05, Student′s t test, unequal variance.

Expression Data
Genes:
Antibody:
Fish:
Anatomical Terms:
Stage Range: 128-cell to Shield

Expression Detail
Antibody Labeling
Phenotype Data

Phenotype Detail
Acknowledgments
This image is the copyrighted work of the attributed author or publisher, and ZFIN has permission only to display this image to its users. Additional permissions should be obtained from the applicable author or publisher of the image. Full text @ PLoS Biol.