
Fig. 6
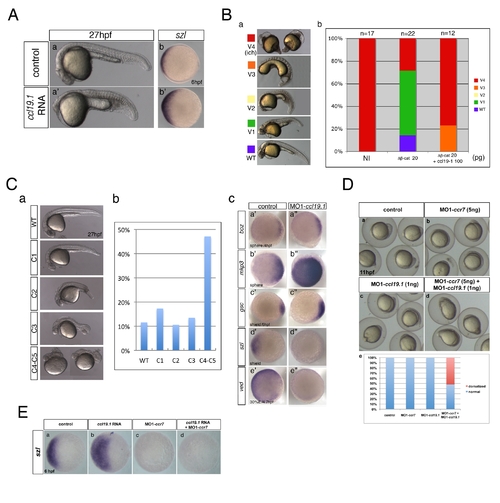
Ccl19.1 chemokine functions as a Ccr7 ligand in axis formation. (A) Injection of ccl19.1 RNA (100–120 pg) resulted in ventralized embryo morphology at 27 hpf (a, a2 n = 30/45; lateral views with anterior to the left) and expansion of szl expression domain (b2) compared to control (b; n = 12/15). Shield stage, animal views with ventral to the left. (B) Ccl19.1 antagonizes the ability of ΔNβ-catenin to rescue the ventralized ich mutant phenotype. (a) V1–V4 phenotypic classes, with V4 corresponding to the strongest ich phenotype (also shown in Figure 3Ca). (b) Frequencies of the V1–V4 phenotypic classes of ich mutant embryos injected with synthetic ΔNβ-catenin RNA alone or co-injected with ccl19.1 RNA. Injected amounts of RNAs in pg are shown below the graph, and the number of embryos in each group, above each bar. (C) (a) The spectrum of dorsalized phenotypes at 27 hpf in embryos injected with 4 ng MO1-ccl19.1 classified into five categories, ranging from C4–C5 (the most severe class) to WT-like. (b) Frequency of each phenotypic category (n = 104, three experiments). (c) WISH analysis of dorsal/ventral markers in ccr19.1 morphants compared to control blastulae. (a2–c3) Expression of dorsal genes was upregulated or expanded: sphere (4 hpf), boz, n = 22/31; mkp3, n = 11/11; shield (6 hpf), gsc, n = 9/10. (d2–e3) Expression domains of ventral genes were reduced: 30% epiboly (4.7 hpf), ved, n = 10/12; shield (6 hpf), szl, n = 11/12. Animal pole views, dorsal to the right. (D) Co-injection of MO1-ccr7 and MO1-ccl19.1 leads to dorsalization in a synergistic fashion. Injection of low doses of MO1-ccr7 (b; n = 24) and MO1-ccl19.1 (c; n = 26) alone did not cause dorsalized phenotypes, as observed for uninjected control embryos (a; 11 hpf, n = 36). (d) Embryos co-injected with the same doses of both MOs resulted in dorsalization (n = 12/23). (e) Frequency of dorsalized embryos in a–d. (E) szl expression was expanded in ccl19.1 RNA-injected (b; 100 pg), compared to uninjected, control embryos (a) and was reduced in MO1-ccr7-injected (c; 12 ng) and ccl19.1 RNA (100 pg) and MO1-ccr7 (12 ng) co-injected embryos (d; two experiments). See text for details. Animal views of shield stage embryos, dorsal to the right. |
| Genes: | |
|---|---|
| Fish: | |
| Knockdown Reagents: | |
| Anatomical Terms: | |
| Stage Range: | Sphere to Shield |
| Fish: | |
|---|---|
| Knockdown Reagents: | |
| Observed In: | |
| Stage Range: | Sphere to Prim-5 |