
Fig. S1
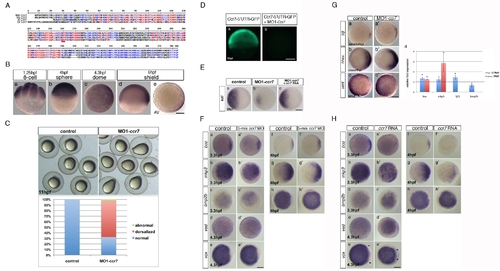
Zebrafish ccr7 gene sequence and expression, MO1-ccr7 efficiency, and specificity tests and expression of region-specific markers in ccr7 morphants. (A) Multiple sequence alignments of selected vertebrate Ccr7 proteins. Mm, Mus musculus; Dr, Danio rerio; Xl, Xenopus laevis; Hs, Homo sapiens. Alignments were carried out using the MultAlin web-based software. (B) Spatiotemporal expression pattern of ccr7 revealed by WISH. ccr7 is expressed maternally (8-cell stage, 1.25 hpf) (a), and its transcripts are uniformly distributed until sphere stage (4 hpf) (b). At dome stage (4.5 hpf), a slight asymmetry in ccr7 expression is observed (c). At shield stage, ccr7 RNA is enriched dorsally (d–e). Lateral views, animal to the top (a, b, d), animal views (c, e). Scale bars in all panels, 200 µm. (C) Embryos injected with MO1-ccr7 (20 ng) exhibited at 11 hpf elongated shape typical of dorsalization; penetrance is shown in the bottom panel. (D) Fluorescent image of zebrafish blastulae at 5.5 hpf injected at 1-cell stage with synthetic RNA encoding ccr7 52UTR-egfp (a) and co-injected with 10 ng of MO1-ccr7 (b). MO1-ccr7 inhibited EGFP expression (n = 24/24) (b). Lateral views. (E) Expression of szl in control (a), MO1-ccr7-injected (c, 10 ng; szl expression reduced in 69%, n = 35), and MO1-ccr7 and ccr7 RNA (100 pg) co-injected embryos (c, szl expression reduced in 26%, n = 50). (F) Expression of dorsal and ventral markers in control uninjected embryos (a–h) and embryos injected with five base mis-matched control morpholino for ccr7 (5-mm ccr7 MO, 20 ng) (a2–h2) revealed by WISH: a, n = 20/20; a2, n = 22/22; b, n = 15/21; b2, n = 14/21; c, n = 22/22; c2, n = 21/21; d, n = 20/20; d2, n = 15/15; e, n = 18/18; e2, n = 17/17; f, n = 19/19; f2, n = 18/18; g, n = 19/19; g2, n = 16/16; h, n = 19/19; h2, n = 16/16. Animal views with dorsal to the right, when the dorsal side is recognizable. (G) Expression of dorsal and ventral markers in control uninjected embryos (a, b, c) and ccr7 morphants (a2, c2, d2) revealed by WISH. Note expanded expression of sqt at 4 hpf (a, a2, 83%, n = 12); hhex at 6 hpf (b, b2, 80%, n = 20), and reduced expression of vent a 4.7 hpf (c, c2, 71%, n = 14). Animal views with dorsal to the right. (d) Quantification of the relative expression levels of boz, mkp3, fgf3, and bmp2b at 3.3 and 4 hpf. See text for details. * p<0.05 (Student′s t-test). (H) Expression of dorsal and ventral markers in control uninjected embryos (a–h) and embryos injected with ccr7 RNA (200 pg) (a2–h2) revealed by WISH: a, n = 20/20; a2, n = 10/16; b, n = 15/21; b2, n = 12/15; c, n = 22/22; c2, n = 10/14; d, n = 20/20; d2, n = 10/15; e, n = 18/18; e2, n = 12/15; f, n = 19/19; f2, n = 9/13; g, n = 19/19; g2, n = 9/13; h, n = 19/19; h2, n = 9/12. Animal views with dorsal to the right, when the dorsal side is recognizable. Arrowheads mark the expansion of ventral expression domain of vox (e and e2). |