
Fig. S5
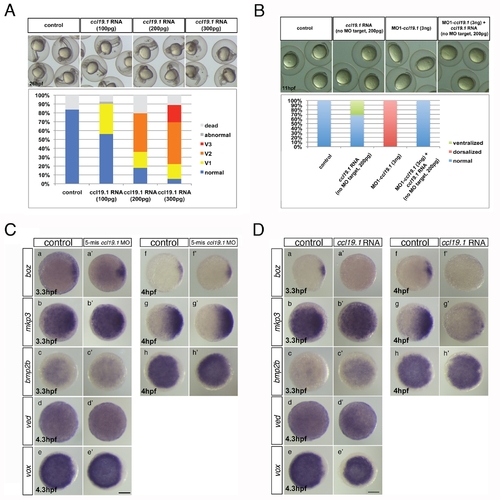
Ccl19.1 overexpression and test of MO1-ccl19.1 specificity. (A) Dose-dependent ventralization of WT embryos injected with ccl19.1 RNA (100–300 pg). V1–V3 classes are defined as in Figure 1B. (B) Ccl19.1 morphants exhibited at 11 hpf dorsalized elongated shape (b), which was suppressed by co-injection of ccl19.1 RNA lacking the MO1-ccl19.1 target site (c, d). (C) Expression of dorsal and ventral markers in control uninjected embryos (a–h) and embryos injected with a five base mis-matched control morpholino for ccl19.1 (5-mm ccl19.1 MO, 4 ng) (a2–h2) revealed by WISH: a, n = 20/20; a2, n = 16/16; b, n = 15/21; b2, n = 9/14; c, n = 22/22; c2, n = 17/17; d, n = 20/20; d2, n = 15/16; e, n = 18/18; e2, n = 19/19; f, n = 19/19; f2, n = 15/15; g, n = 19/19; g2, n = 15/16; h, n = 19/19; h2, n = 15/15. Animal views with dorsal to the right, when the dorsal side is recognizable. (D) Expression of dorsal and ventral markers in control uninjected embryos (a–h) and embryos injected with ccl19.1 RNA (200 pg) (a2–h2) revealed by WISH: a, n = 20/20; a2, n = 10/14; b, n = 15/21; b2, n = 10/14; c, n = 22/22; c2, n = 10/14; d, n = 20/20; d2, n = 9/17; e, n = 18/18; e2, n = 13/17; f, n = 19/19; f2, n = 9/15; g, n = 19/19; g2, n = 12/15; h, n = 19/19; h2, n = 9/14. Animal views with dorsal to the right, when the dorsal side is recognizable. |