
Fig. 3
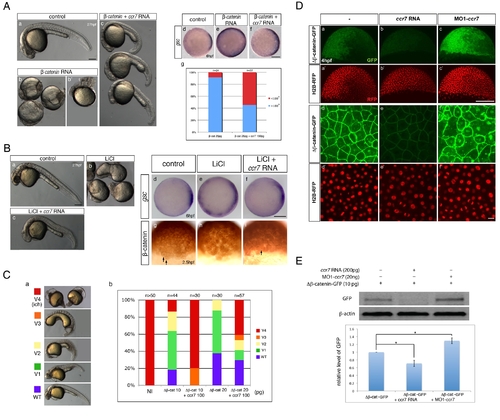
Ccr7 inhibits β-catenin activity via a Gsk3β-indepenedent mechanism. (A) Hyper-dorsalized phenotypes caused by β-catenin overexpression (b,b2, 25 pg, n = 22/25), compared to control WT embryos (a), were suppressed by Ccr7 overexpression (c; 150 pg, n = 8/12). (d–f) Expansion of gsc expression domain in β-catenin overexpressing embryos (e), relative to control WT embryos (d), was suppressed by co-injection of ccr7 RNA (f). Animal views, dorsal to the right. (g) Frequency of embryos with gsc expression domain encompassing more (>180°) or less (<180°) than half of the embryo equator. (B) (a–c) LiCl-treated embryos (b; n = 16/20) show dorsalized phenotypes at 30 hpf compared to control embryos (a). LiCl-dependent dorsalization was suppressed by injection of ccr7 RNA (c; n = 8/20, two experiments). (d–f) gsc expression at shield stage (6 hpf) in control (d), LiCl-treated (e; n = 13/14), and LiCl-treated and ccr7 RNA-injected embryos (f; n = 9/12). Animal views, dorsal to the right. (g–i) β-catenin immunostaining at 256-cell stage in control (g), LiCl-treated (h, n = 9/10), and LiCl-treated embryos overexpressing Ccr7 (i; n = 9/11). Arrows point to a few β-catenin-positive nuclei in control embryos (g) and LiCl-treated embryos overexpressing Ccr7 (i). (C) Ccr7 antagonizes the ability of ΔNβ-catenin to rescue the ventralized ich mutant phenotype. (a) V1–V4 phenotypic classes, with V4 corresponding to the strongest ich phenotype. (b) Frequencies of the V1–V4 phenotypic classes of ich mutants injected with synthetic ΔNβ-catenin RNA alone or co-injected with ccr7 RNA. Injected amounts of RNAs in pg are shown below the graph, and the number of embryos in each group above each bar. (D) (a–c) Co-injections of ΔNβ-catenin-gfp RNA and MO1-ccr7 or ccr7 RNA showed that Ccr7 can downregulate β-catenin, shown at higher-magnification (d–f). Compared to control (a, d), ccr7 RNA overexpressing blastulae showed strongly decreased (b, e), while MO1-ccr7 injected blastulae showed increased, ΔNβ-catenin-GFP signal (c, f). H2B-RFP RNA was injected as nuclear background control (a2–c2 and higher magnification in d2–f2). (E) Western blot analysis of co-injection of ΔNβ-catenin-gfp RNA and ccr7 RNA or MO1-ccr7. Quantification of the relative protein level (signal intensity) from three independent immunoblots (bottom panel). * p<0.05. |
| Gene: | |
|---|---|
| Antibody: | |
| Fish: | |
| Anatomical Terms: | |
| Stage Range: | 256-cell to Shield |