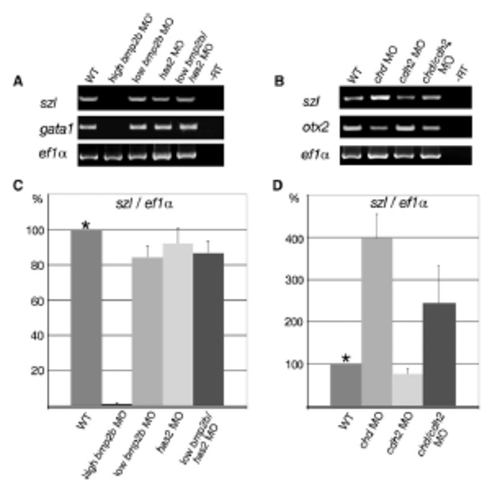
RT-PCR Analyses of Embryos Coinjected with Low Amounts of bmp2b and has2 MOs, or Coinjected with chd and cdh2 MOs, Demonstrating that Dorsoventral Patterning Is Not More Perturbed than in the Respective Single Morphants (A) Semiquantitative RT-PCR with total RNA preparations from embryos at tailbud stage (10 hpf), amplifying transcripts of the ventral marker gene szl [S7, S8] (24 cycles), or from embryos at the 10-somite stage, amplifying transcripts of the blood precursor gene gata1 [S9] (26 cycles). For both stages, transcripts of the translation elongation factor gene ef1α [S10] were amplified as control (20 cycles). Lane 1, uninjected control; lane 2, injection of 0.1 mM bmp2b MO; lane 3, injection of 0.01 mM bmp2b MO; lane 4, injection of 0.1 mM has2 MO; lane 5, coinjection of 0.01 mM bmp2b MO and 0.1 mM has2 MO. In bmp2b, has2 double hypomorphants, szl and gata1 transcript levels are not lower than in bmp2b single hypomorphants, indicating that they are not more strongly dorsalized, in contrast to their enhanced convergence defects (compare with Figure 3). (B) Semiquantitative RT-PCR with total RNA preparations from embryos at the tailbud epiboly stage (10 hpf), amplifying transcripts of the ventral marker gene szl [S7, S8] (24 cycles), the dorsal marker gene otx2 [S6] (25 cycles), or ef1α (20 cycles). Lane 1, uninjected control; lane 2, injection of 0.05 mM chordin MO; lane 3, injection of 0.1 mM cdh2 MO; lane 4, coinjection of 0.05 mM chordin MO and 0.1 mM cdh2 MO. In chd, cdh2 double morphant, szl transcript levels are not higher, and otx2 transcript levels not lower than in chd single morphants, indicating that the double morphants are not more strongly ventralized, in contrast to their enhanced convergence defects (compare with Figure 6). (C and D) Real-time RT-PCR of samples at tailbud stages shown in (A) or (B), respectively, amplifying transcripts of szl and ef1α. Normalized szl versus ef1α values of uninjected wild-type control embryos (WT) are set to 100%. Graphs summarize results from four different PCR reactions (duplicates of two independent experiments). Error bars indicate standard errors, calculated by LightCycler Software 3.5 (Roche). Siblings of embryos processed for RT-PCR were analyzed for convergence defects and displayed the same phenotypes as shown in Figures 3 and 6.
|
