
Fig. 1
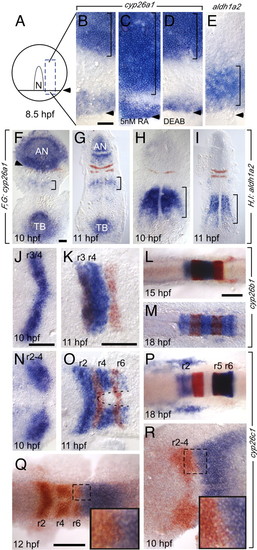
Expression of the cyp26 genes in the developing hindbrain. (A-R) Whole-mount in situ hybridizations during the hindbrain patterning period. All embryos are shown as dorsal views. Anterior is to the top in A-I and to the left in J-R. In situ probes are noted in brackets beside the panels, embryonic age is noted in hours post fertilization (hpf). (A) Schematic of an 80% epiboly (8.5 hpf) embryo. The dotted box is the region shown in the flat-mounted embryos in B-E; the arrowhead indicates the advancing margin of the epiblast. During gastrulation, cyp26a1 (B-D,F,G) is expressed in the ectoderm (bracket in B-D) anterior to the domain of RA synthesis indicated by aldh1a2 expression (bracket in E). (C,D) Ectodermal cyp26a1 expression expands in the presence of sub-teratogenic concentrations of RA (C), but is established independent of RA (D). (F,G) cyp26a1 expression recedes anteriorly at the onset of somitogenesis. krox20 (red) is shown in r3 and r5. Arrowhead indicates the posterior limit of cyp26a1 expression. Bracket marks weak cyp26a1expression in the anterior trunk mesoderm. (H,I) aldh1a2 expression during early somitogenesis. Bracket shows expression in trunk mesoderm. (J-R) Dynamic cyp26b1 (J-M) and cyp26c1 (N-R) expression during somitogenesis. krox20 expression in r3 and r5 is in red in J-P; cyp26b1 expression is shown in blue in J-M; and cyp26c1 expression is shown in blue in N-R. In Q,R, cyp26c1 is in red whereas hoxd4 (Q) and vhnf1 (R) are in blue. Insets in Q,R correspond to the dotted boxes. Dotted curve in O indicates the cyp26c1-free domain in ventral r3-r6. Scale bars: 100 μM. Scale bar in B is for B-E; scale bar in F is for F-I; scale bar in J is for J,N,R; scale bar in K is for K,O; scale bar in L is for L,M,P. AN; anterior neurectodermal expression; TB, tailbud expression. |