
- Title
-
Defective Jagged1 signaling impacts GnRH development and contributes to congenital hypogonadotropic hypogonadism
- Authors
- Cotellessa, L., Marelli, F., Duminuco, P., Adamo, M., Papadakis, G.E., Bartoloni, L., Sato, N., Lang-Muritano, M., Troendle, A., Dhillo, W.S., Morelli, A., Guarnieri, G., Pitteloud, N., Persani, L., Bonomi, M., Giacobini, P., Vezzoli, V.
- Source
- Full text @ JCI Insight
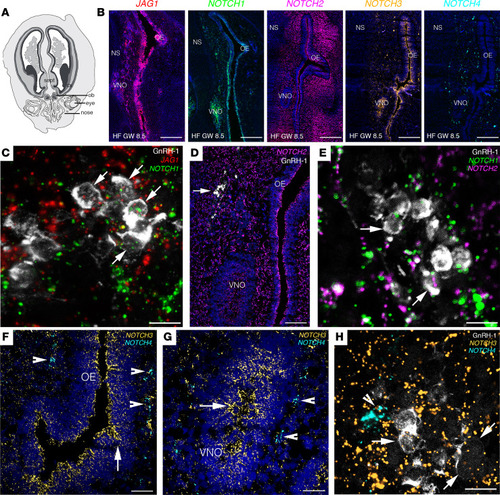
JAG1 and Notch receptors are expressed in GnRH cells and in the olfactory/vomeronasal systems of human fetuses.
(A) Schematic representation of a GW 8.5 human fetus head (coronal view). (B) Expression of JAG1 and NOTCH1-NOTCH4 in coronal section of the nasal compartment of a GW 8.5 human fetus. (C–H) High-power micrographs of FISH analysis for JAG1 and NOTCH1–NOTCH4 coupled with immunofluorescence for GnRH. Arrows in C point to GnRH-1 neurons expressing JAG1 and NOTCH1 transcripts. Arrows in D point to GnRH-1 neurons. Arrows in E point to GnRH-1 neurons expressing NOTCH1 and NOTCH2 transcripts. Arrowheads in F and G point to NOTCH4-expressing cells, and arrows highlight NOTCH3-expressing territories in the OE and VNO. Arrows in H point to GnRH-1 neurons expressing NOTCH3 transcripts and arrowhead depicts NOTCH4-expressing cells. OB, olfactory bulb; cx, cortex; sept, septum; OE, olfactory epithelium; VNO, vomeronasal organ; NS, nasal septum, HF, human fetus; GW, gestational weeks. Scale bars: 800 μm, B; 10 μm, C, E, and H; 200 μm, D; 100 μm, F and G. FISH experiments were replicated 3 times with similar results in n = 2 samples (GW 8.5 and GW 11). |
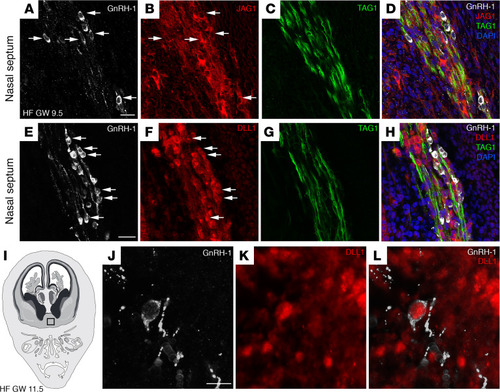
JAG1 and DLL1 proteins are expressed in GnRH neurons and in the olfactory/vomeronasal system of human fetuses.
(A–D) Representative confocal images of the nasal septum of a GW 9.5 fetus immunostained for GnRH1 (white), JAG1 (red), and TAG1 (green). JAG1 (arrows, B) is expressed by GnRH1-expressing neurons (arrows, A), as well as by other neurons belonging to the MM and by vomeronasal/terminal fibers expressing TAG1. (E–H) GnRH1 (white), DLL1 (red), and TAG1 (green) expression in a coronal section of the nasal region of a GW 9.5 fetus. DLL1 is expressed by GnRH neurons (arrows, E and F), by other neurons belonging to the MM, and by vomeronasal/terminal fibers. (I) Schematic representation of a GW 11.5 human fetus head (coronal view). The black box indicates the forebrain region of immunofluorescence analysis displayed in J–L. (J–L) DLL1 is expressed by a GnRH neuron that entered the forebrain. Scale bars: 20 μm. The experiments were replicated 3 times with similar results in n = 2 samples (GW 9.5 and GW 11.5). HF, human fetus. |
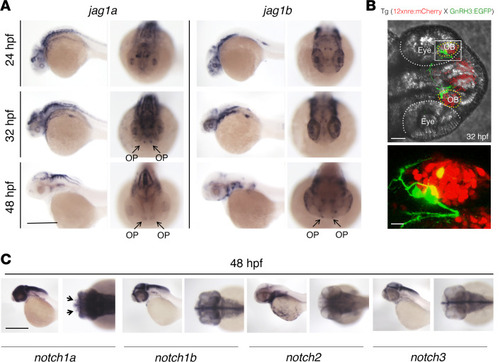
Jag1a, jag1b, notch1a, and gnrh3 mRNAs are expressed in the OP of zebrafish embryos at 48 hpf.
(A) WISH on zebrafish embryos at 24 hpf, 32 hpf, and 48 hpf for jag1a and jag1b mRNAs. WISH was replicated 4 times with n = 15 WT embryos. Jag1a and jag1b are both expressed within the OP (arrows). (B) Representative confocal image of the double reporter line tg(12xnre:mCherry × GnRH3:EGFP) showing the expression of GnRH3 (green) and of the NRE (red) in the OBs of zebrafish embryos at 32 hpf. The experiments were replicated 3 times with n = 10 EGFP and mCherry double-positive embryos. (C) WISH on zebrafish embryos at 48 hpf showing notch1a mRNA localization in the OP (arrows). WISH was replicated 4 times with n = 15 WT embryos. Scale bars: 0.5 mm, A and C; 40 μm, B upper panel; 10 μm, B lower panel. |
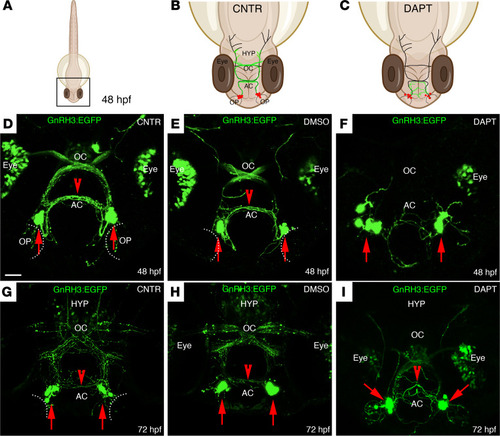
DAPT treatment affects the localization of GnRH3 neurons and their axonal projections.
(A–C) Schematic representations of a 48 hpf zebrafish embryo. (B and C) Schematic representations of the boxed square area depicted in A, representing the distribution of GnRH3 cell bodies (red dots) and of GnRH3 neurites (green lines) in control (CNTR) and DAPT-treated embryos. The treatment was performed 3 times with n = 30 WT embryos/condition. (D–F) Representative confocal images of tg(GnRH3:EGFP) CNTR embryos (D), DMSO-treated embryos (E), and DAPT-treated embryos (F) at 48 hpf. (G–I) Representative confocal images of tg(GnRH3:EGFP) embryos at 72 hpf, under the different treatment conditions. Scale bar: 100 μm. AC, anterior commissure; OC, optic chiasm; HYP, hypothalamus. |
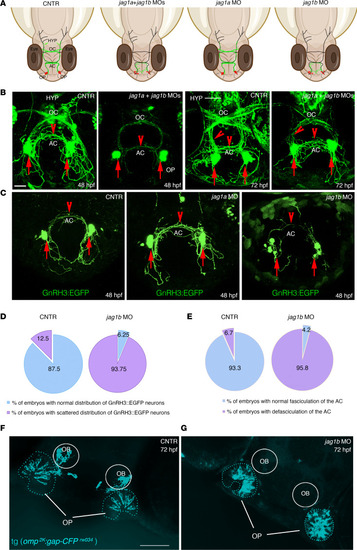
jag1b, but not jag1a, affects the distribution of GnRH3 neurons and their axonal projections.
(A) Schematic representations of 48 hpf zebrafish embryos and representing the distribution of GnRH3 cell bodies (red dots) and of GnRH3 neurites (green lines) under the indicated experimental conditions. (B) Confocal analysis of tg(GnRH3:EGFP) control embryos and jag1a + jag1b double morphants at 48 hpf and 72 hpf, respectively. The experiments were performed 5 times with n = 15 EGFP-positive embryos/condition. (C) Confocal analysis of tg(GnRH3:EGFP) control embryos and jag1a and jag1b morphants at 48 hpf. Arrows indicate GnRH3-positive cells in the OP; arrowheads indicate GnRH3 fibers in the AC and innervating hypothalamus. HYP, hypothalamus. Red arrows indicate the somata of GnRH3+ cells. Red arrowheads highlight the GnRH3+ fiber in the AC or innervating hypothalamus at 72 hpf. (D) Percentage of embryos showing a scattered GnRH3+ cell phenotype between controls and jag1b morphants at 48 hpf. (E) Percentage of embryos showing a defasciculation of the AC between controls and jag1b morphants at 48 hpf. Mann-Whitney U test followed by a Fisher’s exact test. (F and G) Representative confocal images of tg(omp2k:gap-CFP rw034) control (F) and jag1b MO embryos (G). The experiments were performed 4 times with n = 15 tg(omp2k:gap-CFP rw034) embryos/condition. Scale bars: 100 μm, B and C; 50 μm, F and G. |
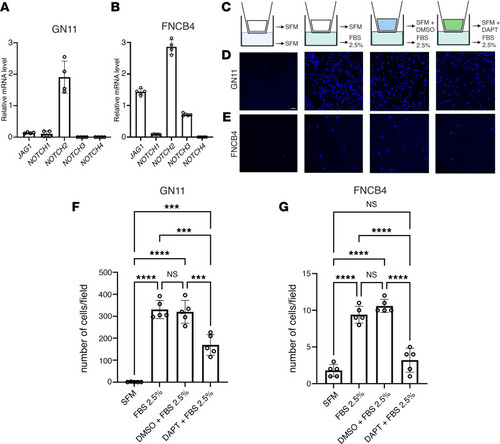
Notch inhibition impairs GnRH cell motility in vitro.
(A and B) qRT-PCR analysis of indicated transcripts normalized to Actb in GN11 cells (n = 4) and to S18 in FNCB4 cells (n = 5 for all genes, n = 4 for NOTCH2). (C) Schematic depiction of the Transwell assays. (D and E) Representative photomicrographs showing Hoechst nuclear staining of the migrated GN11 (D) and FNCB4 cells (E) after the different treatment conditions indicated in C. (F and G) Bar graphs illustrate the mean number of migrated GN11 cells (F) and FNCB4 cells (G) (n = 5 per condition). Comparison between the different treatment conditions were performed using a 2-way ANOVA followed by Tukey’s multiple-comparison post hoc test; ***P < 0.0005 and ****P < 0.0001. Data are represented as the mean ± SEM. Scale bar: 50 μm. |
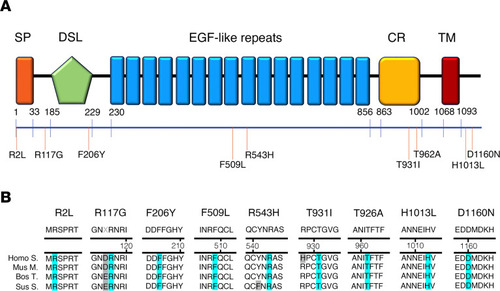
JAG1 heterozygous mutations in CHH probands.
(A) Schematic illustration of JAG1 mutations in nCHH and KS probands. The signal peptide (SP), the Delta:Serrate:LAG-2 (DSL) domain, the EGF-like repeats, the cysteine-rich region (CR), and the transmembrane domain (TM) are represented. The relative position of the variants is indicated on the illustration. (B) Alignment of partial protein sequences of JAG1 orthologs showing in blue the amino acid residues evolutionarily conserved. |
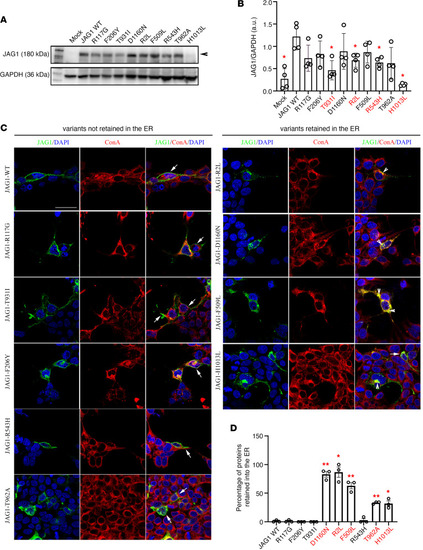
Functional validation of JAG1 variants in vitro.
(A) Representative Western blot gels showing JAG1 and GAPDH expression in cell lysates of HEK293T cells transiently transfected with the empty vector (mock), with the JAG1 WT vector, or with each of the JAG1 variants. (B) Bar graph illustrates the mean ratio ± SEM JAG1 over GAPDH (n = 4 for all). Mann-Whitney U test followed by a Fisher’s exact test, *P < 0.05. a.u., arbitrary unit. (C) Confocal representative images of HEK293T cells transfected with JAG1 WT and JAG1 mutants and immunostained for JAG1 (green) and ConA (red). Nuclei were counterstained with DAPI (blue). Arrows point to the membrane JAG1 localization and arrowheads point to intracellular JAG1 retention. The experiments have been replicated 3 times. (D) Graph showing the percentage of JAG1 retention in the ER. Comparisons between treatment groups (n = 3 cultures/condition and n = 100 total cells analyzed/condition) were performed using a 1-way ANOVA followed by Tukey’s multiple-comparison post hoc test; *P < 0.05, **P < 0.005. Data represent mean ± SEM. Scale bar: 20 μm. |