
Figure 8
- ID
- ZDB-FIG-230407-19
- Publication
- Cotellessa et al., 2023 - Defective Jagged1 signaling impacts GnRH development and contributes to congenital hypogonadotropic hypogonadism
- Other Figures
- All Figure Page
- Back to All Figure Page
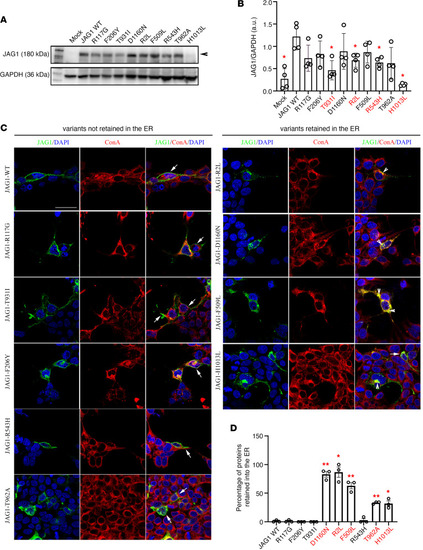
Functional validation of JAG1 variants in vitro.
(A) Representative Western blot gels showing JAG1 and GAPDH expression in cell lysates of HEK293T cells transiently transfected with the empty vector (mock), with the JAG1 WT vector, or with each of the JAG1 variants. (B) Bar graph illustrates the mean ratio ± SEM JAG1 over GAPDH (n = 4 for all). Mann-Whitney U test followed by a Fisher’s exact test, *P < 0.05. a.u., arbitrary unit. (C) Confocal representative images of HEK293T cells transfected with JAG1 WT and JAG1 mutants and immunostained for JAG1 (green) and ConA (red). Nuclei were counterstained with DAPI (blue). Arrows point to the membrane JAG1 localization and arrowheads point to intracellular JAG1 retention. The experiments have been replicated 3 times. (D) Graph showing the percentage of JAG1 retention in the ER. Comparisons between treatment groups (n = 3 cultures/condition and n = 100 total cells analyzed/condition) were performed using a 1-way ANOVA followed by Tukey’s multiple-comparison post hoc test; *P < 0.05, **P < 0.005. Data represent mean ± SEM. Scale bar: 20 μm. |