
Figure 5
- ID
- ZDB-FIG-230407-16
- Publication
- Cotellessa et al., 2023 - Defective Jagged1 signaling impacts GnRH development and contributes to congenital hypogonadotropic hypogonadism
- Other Figures
- All Figure Page
- Back to All Figure Page
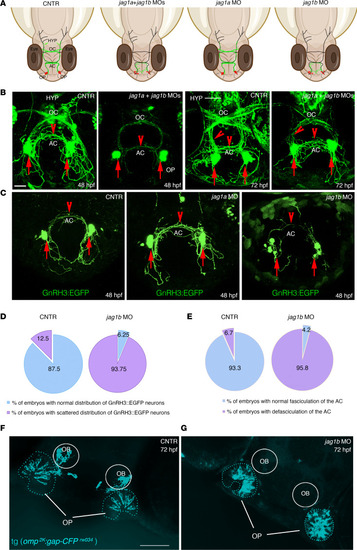
jag1b, but not jag1a, affects the distribution of GnRH3 neurons and their axonal projections.
(A) Schematic representations of 48 hpf zebrafish embryos and representing the distribution of GnRH3 cell bodies (red dots) and of GnRH3 neurites (green lines) under the indicated experimental conditions. (B) Confocal analysis of tg(GnRH3:EGFP) control embryos and jag1a + jag1b double morphants at 48 hpf and 72 hpf, respectively. The experiments were performed 5 times with n = 15 EGFP-positive embryos/condition. (C) Confocal analysis of tg(GnRH3:EGFP) control embryos and jag1a and jag1b morphants at 48 hpf. Arrows indicate GnRH3-positive cells in the OP; arrowheads indicate GnRH3 fibers in the AC and innervating hypothalamus. HYP, hypothalamus. Red arrows indicate the somata of GnRH3+ cells. Red arrowheads highlight the GnRH3+ fiber in the AC or innervating hypothalamus at 72 hpf. (D) Percentage of embryos showing a scattered GnRH3+ cell phenotype between controls and jag1b morphants at 48 hpf. (E) Percentage of embryos showing a defasciculation of the AC between controls and jag1b morphants at 48 hpf. Mann-Whitney U test followed by a Fisher’s exact test. (F and G) Representative confocal images of tg(omp2k:gap-CFP rw034) control (F) and jag1b MO embryos (G). The experiments were performed 4 times with n = 15 tg(omp2k:gap-CFP rw034) embryos/condition. Scale bars: 100 μm, B and C; 50 μm, F and G. |
| Gene: | |
|---|---|
| Fish: | |
| Anatomical Terms: | |
| Stage: | Protruding-mouth |