
|
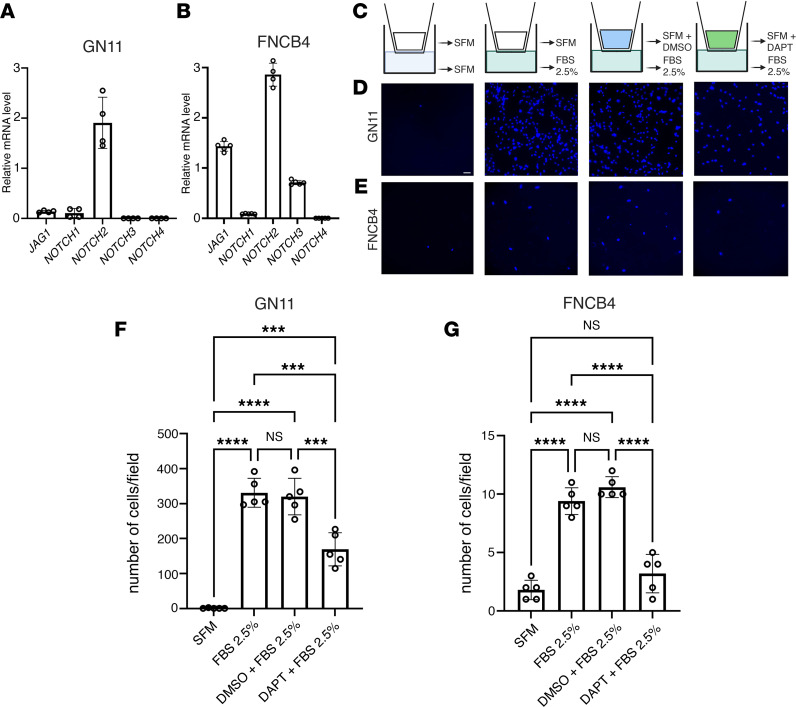
Figure 6
(A and B) qRT-PCR analysis of indicated transcripts normalized to Actb in GN11 cells (n = 4) and to S18 in FNCB4 cells (n = 5 for all genes, n = 4 for NOTCH2). (C) Schematic depiction of the Transwell assays. (D and E) Representative photomicrographs showing Hoechst nuclear staining of the migrated GN11 (D) and FNCB4 cells (E) after the different treatment conditions indicated in C. (F and G) Bar graphs illustrate the mean number of migrated GN11 cells (F) and FNCB4 cells (G) (n = 5 per condition). Comparison between the different treatment conditions were performed using a 2-way ANOVA followed by Tukey’s multiple-comparison post hoc test; ***P < 0.0005 and ****P < 0.0001. Data are represented as the mean ± SEM. Scale bar: 50 μm.