
|
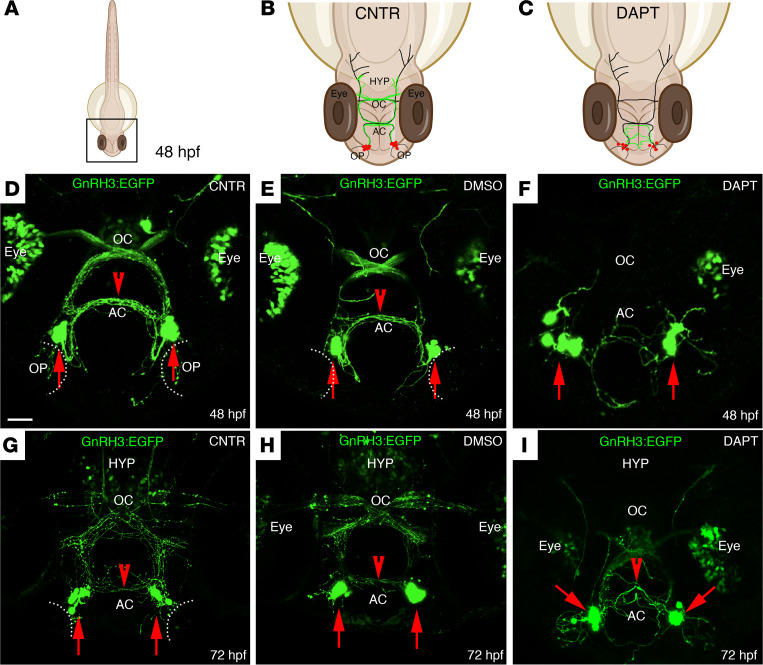
Figure 4
(A–C) Schematic representations of a 48 hpf zebrafish embryo. (B and C) Schematic representations of the boxed square area depicted in A, representing the distribution of GnRH3 cell bodies (red dots) and of GnRH3 neurites (green lines) in control (CNTR) and DAPT-treated embryos. The treatment was performed 3 times with n = 30 WT embryos/condition. (D–F) Representative confocal images of tg(GnRH3:EGFP) CNTR embryos (D), DMSO-treated embryos (E), and DAPT-treated embryos (F) at 48 hpf. (G–I) Representative confocal images of tg(GnRH3:EGFP) embryos at 72 hpf, under the different treatment conditions. Scale bar: 100 μm. AC, anterior commissure; OC, optic chiasm; HYP, hypothalamus.