
|
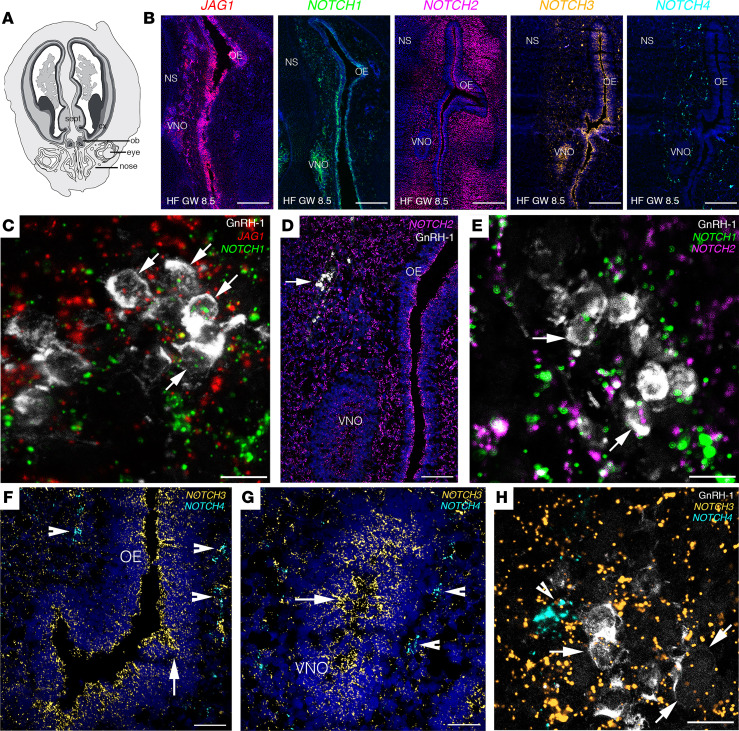
Figure 1
(A) Schematic representation of a GW 8.5 human fetus head (coronal view). (B) Expression of JAG1 and NOTCH1-NOTCH4 in coronal section of the nasal compartment of a GW 8.5 human fetus. (C–H) High-power micrographs of FISH analysis for JAG1 and NOTCH1–NOTCH4 coupled with immunofluorescence for GnRH. Arrows in C point to GnRH-1 neurons expressing JAG1 and NOTCH1 transcripts. Arrows in D point to GnRH-1 neurons. Arrows in E point to GnRH-1 neurons expressing NOTCH1 and NOTCH2 transcripts. Arrowheads in F and G point to NOTCH4-expressing cells, and arrows highlight NOTCH3-expressing territories in the OE and VNO. Arrows in H point to GnRH-1 neurons expressing NOTCH3 transcripts and arrowhead depicts NOTCH4-expressing cells. OB, olfactory bulb; cx, cortex; sept, septum; OE, olfactory epithelium; VNO, vomeronasal organ; NS, nasal septum, HF, human fetus; GW, gestational weeks. Scale bars: 800 μm, B; 10 μm, C, E, and H; 200 μm, D; 100 μm, F and G. FISH experiments were replicated 3 times with similar results in n = 2 samples (GW 8.5 and GW 11).