
- Title
-
Esculetin Alleviates Nonalcoholic Fatty Liver Disease on High-Cholesterol-Diet-Induced Larval Zebrafish and FFA-Induced BRL-3A Hepatocyte
- Authors
- Ma, J., Deng, Y., Yang, T., Li, M., Shang, J.
- Source
- Full text @ Int. J. Mol. Sci.
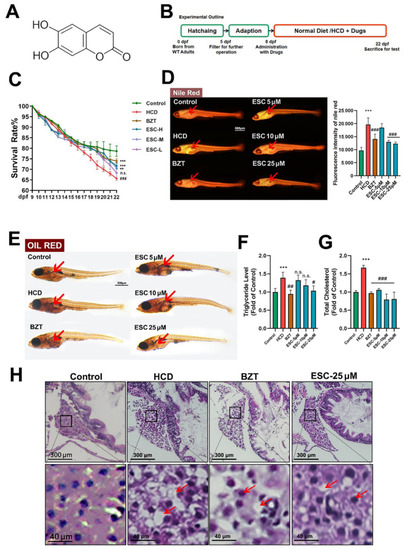
Lipid lowering effect of ESC on an HCD-induced larval zebrafish model. (A) The chemical structure of ESC. (B) Experimental outline of the larval zebrafish experiments. (C) Survival rate of Tablelarval zebrafish. (D) Nile red stain of larval zebrafish. (E) Oli red stain of larval zebrafish. (F) Triglyceride of larval zebrafish. (G) Total cholesterol of larval zebrafish. (H) HE stain of larval zebrafish liver, and the hepatic steatosis is pointed by red arrows. Bar indicates means ± SD. ** p < 0.01, *** p < 0.001 represent compared with the control; n.s. represents no significance; # p < 0.05, ## p < 0.01, ### p < 0.001 represents compared with the model. p < 0.05 was considered as statistically significant calculated by One-way ANOVA followed by Tukey’s test (n = 3, n indicates the replicates of the experiment). PHENOTYPE:
|
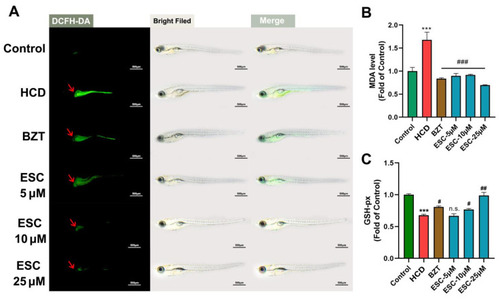
Anti-oxidant effect of ESC on an HCD-induced larval zebrafish model. (A) The DCFH-DA stain of larval zebrafish. (B) MDA of larval zebrafish. ( PHENOTYPE:
|

NAFLD-related mRNA expression changes in ESC on the HCD-induced Larval Zebrafish Model. (A) The gene expression level of lipogenesis on larval zebrafish. (B) The gene expression level of lipometabolism on larval zebrafish. (C) The gene expression level of oxidant stress on larval zebrafish. (D) The gene expression level of inflammation on larval zebrafish. Bar indicates means ± SD. * p < 0.05, *** p < 0.001 represent compared with the control; n.s. represents no significance; # p < 0.05, ### p < 0.001 represents compared with the model. p < 0.05 was considered as statistically significant calculated by One-way ANOVA followed by Tukey’s test (n = 3, indicates the replicates of the experiment). EXPRESSION / LABELING:
PHENOTYPE:
|

Effects of ESC on FFA−induced BRL−3A hepatocyte in vitro. (A) The BRL−3A hepatocyte stained with nile red. (B) The Triglyceride (TG) level of BRL-3A hepatocyte. (C) The ROS level of BRL−3A hepatocyte. (D) Western blot and relative protein expression of BRL−3A hepatocyte. ( |