
- Title
-
Expression of myelin transcription factor 1 and lamin B receptor mediate neural progenitor fate transition in the zebrafish spinal cord pMN domain
- Authors
- Xing, L., Chai, R., Wang, J., Lin, J., Li, H., Wang, Y., Lai, B., Sun, J., Chen, G.
- Source
- Full text @ J. Biol. Chem.
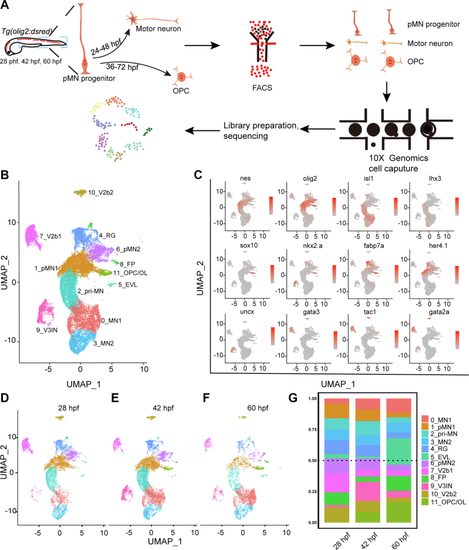
Single-cell transcriptome maps of olig2+cells in the zebrafish spinal cords.A, diagrams of the scRNA-seq workflow. B, UMAP clustering of single-cell samples. Colors indicate distinct groups. C, the expression of marker genes visualized by UMAP. The colors denote the expression values. The darker the color, the higher the expression. D–F, cell subpopulations across three different developmental time points at 28 hpf, 42 hpf, and 60 hpf. G, percentages of cell types at different time points. EVL, enveloping layer; FP, floor plates; hpf, hour post fertilization; pMN, pMN progenitors; RG, radial glia; scRNA-seq, single-cell RNA sequencing; UMAP, Uniform Manifold Approximation and Projection; V2b, V2b interneurons; V3IN, V3 interneurons. |
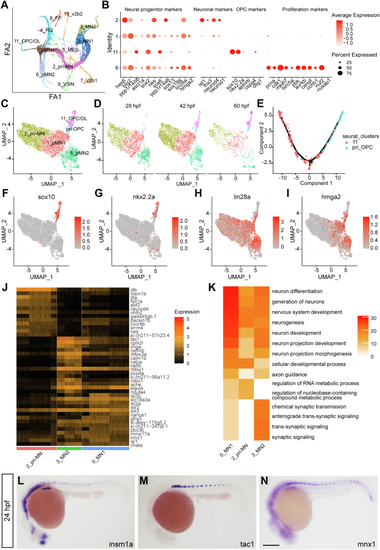
Heterogeneity and lineage inference analyses of pMN progenitors for motor neurons and OPCs.A, cell trajectory analysis by Partition-based Graph Abstraction (PAGA). B, dot plot reveals expression levels of marker genes for progenitors, neurons, OPCs, and proliferating cells. Dot size represents the percentage of marker genes expressed in each cell population, and the color depicts the average expression of each gene. C and D, UMAP of pri-OPCs. E, lineage inference analysis by Monocle in the pri-OPCs and OPCs. F–I, UMAP of markers in the OPC (F and G) and progenitors (H and I) reveals the existence of pri-OPCs. J and K, enriched markers (J) and Go terms (K) in the pri-MN, MN_1, and MN_2. Color scales denote expression levels (J) and the statistical significance (K), respectively. L–N, in situ hybridization confirms RNA patterns of the pri-MN marker insm1a and MN_2 marker tac1, which have similar expression pattern as the neuronal marker mnx1 in the spinal cord. The scale bar represents 100 μm. OPC, oligodendrocyte progenitor cell; pri-MN, primitive motor neuron; pri-OPC, primitive oligodendrocyte progenitor cell; UMAP, Uniform Manifold Approximation and Projection. |

Identification of neural progenitors for a second motor neuron lineage.A and B, the expression of neural progenitor markers hes6 and sox2 by UMAP. C, enriched markers in the radial glia compared to the pMN progenitors. D, enriched pathways of differential genes in radial glia and pMN progenitors. E, subclustering of the radial glia by UMAP. F, the expression of olig2 in radial glia subpopulations by UMAP. G, enriched markers of radial glia subpopulations. H, proliferation scores (G2M scores) of subpopulations in the radial glia. I, major enriched pathways in radial glia subpopulations. J, lineage inference analysis of subpopulations in the radial glia. K–M, the expression of motor neuronal markers in subpopulations of radial glia. N, singleR analysis between radial glia subpopulations and other representative cells. O, heatmaps showing gene expression in motor neurons and in subpopulations of radial glia. Selected genes were expressed in at least 60% of MN1 or MN2. P–R, olig2+ cells are sometimes colabeled with GFAP. Confocal images of whole-mount Tg(olig2:dsRed; gfap:GFP) embryos at 72 hpf, lateral view. Images from a single confocal slice. Notice that dsRed+ nuclei are surrounded by the GFP driven by the gfap promoter (arrows). Boxes a–d showing the enlarged images in the R. S, motor neuron projections were observed in Tg(gfap:GFP). Arrows denote the projections from the spinal cord to the periphery. Dorsal top, caudal left. The scale bar represents 50 μm in (R) and (S). The scale bar represents 10 μm in d. hpf, hour post fertilization; UMAP, Uniform Manifold Approximation and Projection. |

Identification of neural progenitors for interneurons.A–C, the expression markers of sv2, nestin (progenitor markers), and olig2 in Interneuron_7 by UMAP. D–G, trajectory lineage inference of subpopulations (1 and 2) in interneuron_7 reveals the developmental trajectory from the olig2+/nestin+ cells to sv2+ neurons. H, enriched Go terms for four distinct neural progenitors. I–N, violin plots showing the expression neural progenitor or proliferation markers. UMAP, Uniform Manifold Approximation and Projection. |

Lineage and transcription factor analysis for motor neuron and OPC lineages.A, monocle showing the putative developmental processes of progenitors or precursors in the pMN domain. Each dot represents an individual cell. Bifurcation of pMN progenitors into motor neuron (2) and OPC (11) lineages is shown. B, cells in (A) are shown in pseudotime. C, the temporal distribution of progenitors or precursors in the pMN domain. D, expression of known markers along the motor neuron or OPC lineage ordered in pseudotime. Note that isl1, mnx1, and neurod1 are enriched in the motor neuron branch, but nkx2.2a, olig1, sox10 are enriched in the OPC branch. E, heatmaps of the most differentially expressed transcription factors prebranching, in the motor neuron and OPC lineages. The color red denotes upregulation; blue denotes downregulation of genes. OPC, oligodendrocyte progenitor cell. |
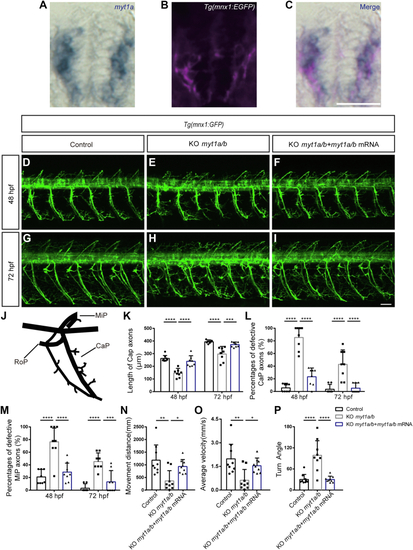
Myt1 is necessary for the development of motor neurons.A–C, transverse sections of spinal cord showing myt1a RNA (blue) in Tg(mnx1:EGFP) (pink) embryos. Dorsal top, rostral left. The scale bar represents 25 μm. D–I, confocal imaging analysis of primary motor neurons in control, KO myt1a/b, and mRNA rescue groups at 48 hpf (D–F) and 72 hpf (G–I) Tg(mnx1:GFP). Arrowhead denotes round-shaped and undifferentiated neuronal cells. The scale bar represents 50 μm. Arrows denote missing or shortened MiP or CaP axons. Dashline in (H) shows CaP axons at 72 hpf. Enlarged images of (D–I) are available at Fig. S7. J, schematic diagram of three primary motor axon projections (CaP, MiP, and RoP) in zebrafish. K, the length of CaP axons of zebrafish in the control group, in the KO myt1a/b group, and in the mRNA rescue group at 48 hpf (n = 8 in each group, ∗∗∗∗p < 0.0001, one-way ANOVA followed by Turkey’s test) and 72 hpf (n = 8 in each group, ∗∗∗∗p < 0.0001, ∗∗∗p < 0.001, one-way ANOVA followed by Turkey’s test). L, the percentages of defective CaP axons in the control group, the KO myt1a/b group, and in the mRNA rescue group at 48 hpf (n = 8 in each group, ∗∗∗∗p < 0.0001, one-way ANOVA followed by Turkey’s test) and 72 hpf (n = 8 in each group, ∗∗∗∗p < 0.0001, one-way ANOVA followed by Turkey’s test). M, the percentages of defective MiP axons in the control group, the KO myt1a/b group, and mRNA rescue group at 48 hpf (n = 8 in each group, ∗∗∗∗p < 0.0001, ∗∗∗p < 0.001, one-way ANOVA followed by Turkey’s test) and 72 hpf (n = 8 in each group, ∗∗∗∗p < 0.0001, ∗∗∗p < 0.001, one-way ANOVA followed by Turkey’s test). N and O, distance and velocity analysis in the control group, the KO myt1a/b group, and mRNA rescue group in 5 dpf larvae (n = 9, respectively, ∗∗p < 0.01, ∗p < 0.05, one-way ANOVA followed by Turkey’s test) by the video tracking software EthoVision XT. P, turn angle in the control group, the KO myt1a/b group, and mRNA rescue group in 5 dpf larvae (n = 9, ∗∗∗∗p < 0.0001, one-way ANOVA followed by Turkey’s test). All data were shown as the mean ± SD. ∗, ∗∗, ∗∗∗, and ∗∗∗∗ denote p < 0.05, p < 0.01, p < 0.001, p < 0.0001, respectively. n.s., not significant. hpf, hour post fertilization. |

lbr is enriched in proliferative neural progenitor or radial glial cells.A, DEG analysis between pMN_1 and pMN_2. B and C, upregulated (B) and downregulated (C) pathways in pMN_1. D, enriched genes in subpopulations of radial glia. Notice that lbr is enriched in proliferative radial glia (RG_2). E, UMAP visualization of cell cycle–related genes. Panel E's clusters are identical to those in Figure 1B's. Notice that the expression of lbr is highly correlated with other cell cycle–related genes. DEG, differentially expressed gene; UMAP, Uniform Manifold Approximation and Projection. |
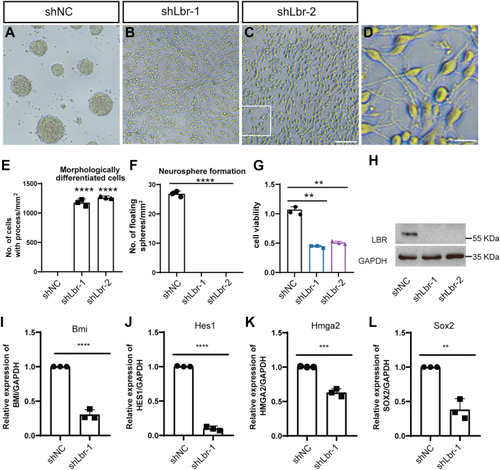
Cell culture of neural stem cells dissected from mouse brain.A–C, morphology of cells transfected with a scrambled control (shNC, A) and Lbr knock down lentivirus (shLbr-1 and shLbr-2, B and C). The scale bar represents 100 μm. D, the enlarged images from the boxed area in (C). The scale bar represents 25 μm. E and F, quantification of cells with processes (E) and the number of neurosphere formation (F). G, CCK8 analysis of cells transfected with Lbr lentivirus. H, Western blot reveals a dramatic decrease of LBR expression in cells transfected with shLbr-1 or shLbr-2. I–L, qPCR analysis of stemness-related genes. Data were shown as the mean ± SD. ∗∗, ∗∗∗, and ∗∗∗∗ denote p < 0.01, p < 0.001, p < 0.0001, respectively. |
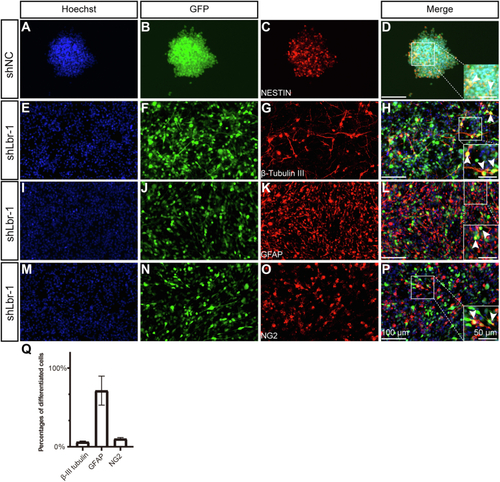
Characterization of cells transfected with Lbr lentivirus.A–D, neurospheres formed in shNC. E–P, cell morphology and antibody staining in cells transfected with Lbr lentivirus. Hoechst (counterstaining for cell nuclei), GFAP (an astrocytic marker), NG2 (an OPC marker), and β-III tubulin (a neuronal marker) are used. The scale bar represents 100 μm in (P). The scale bar represents 50 μm in enlarged images. GFP is carried by the lentivirus. Arrowheads represent representative colabeling between GFP and β-III tubulin, NG2, or GFAP. Not all colabeled cells are marked. Q, quantification of differentiated cells transfected by Lbr lentivirus. Data were shown as the mean ± SD. OPC, oligodendrocyte progenitor cell. |