
Figure 2
- ID
- ZDB-FIG-221008-30
- Publication
- Xing et al., 2022 - Expression of myelin transcription factor 1 and lamin B receptor mediate neural progenitor fate transition in the zebrafish spinal cord pMN domain
- Other Figures
- All Figure Page
- Back to All Figure Page
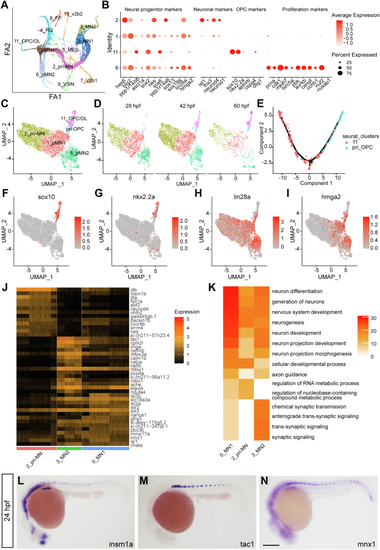
Heterogeneity and lineage inference analyses of pMN progenitors for motor neurons and OPCs.A, cell trajectory analysis by Partition-based Graph Abstraction (PAGA). B, dot plot reveals expression levels of marker genes for progenitors, neurons, OPCs, and proliferating cells. Dot size represents the percentage of marker genes expressed in each cell population, and the color depicts the average expression of each gene. C and D, UMAP of pri-OPCs. E, lineage inference analysis by Monocle in the pri-OPCs and OPCs. F–I, UMAP of markers in the OPC (F and G) and progenitors (H and I) reveals the existence of pri-OPCs. J and K, enriched markers (J) and Go terms (K) in the pri-MN, MN_1, and MN_2. Color scales denote expression levels (J) and the statistical significance (K), respectively. L–N, in situ hybridization confirms RNA patterns of the pri-MN marker insm1a and MN_2 marker tac1, which have similar expression pattern as the neuronal marker mnx1 in the spinal cord. The scale bar represents 100 μm. OPC, oligodendrocyte progenitor cell; pri-MN, primitive motor neuron; pri-OPC, primitive oligodendrocyte progenitor cell; UMAP, Uniform Manifold Approximation and Projection. |