
Figure 1
- ID
- ZDB-FIG-221008-29
- Publication
- Xing et al., 2022 - Expression of myelin transcription factor 1 and lamin B receptor mediate neural progenitor fate transition in the zebrafish spinal cord pMN domain
- Other Figures
- All Figure Page
- Back to All Figure Page
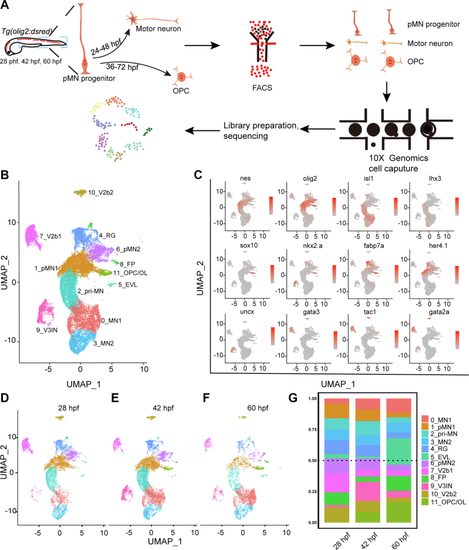
Single-cell transcriptome maps of olig2+cells in the zebrafish spinal cords.A, diagrams of the scRNA-seq workflow. B, UMAP clustering of single-cell samples. Colors indicate distinct groups. C, the expression of marker genes visualized by UMAP. The colors denote the expression values. The darker the color, the higher the expression. D–F, cell subpopulations across three different developmental time points at 28 hpf, 42 hpf, and 60 hpf. G, percentages of cell types at different time points. EVL, enveloping layer; FP, floor plates; hpf, hour post fertilization; pMN, pMN progenitors; RG, radial glia; scRNA-seq, single-cell RNA sequencing; UMAP, Uniform Manifold Approximation and Projection; V2b, V2b interneurons; V3IN, V3 interneurons. |