
|
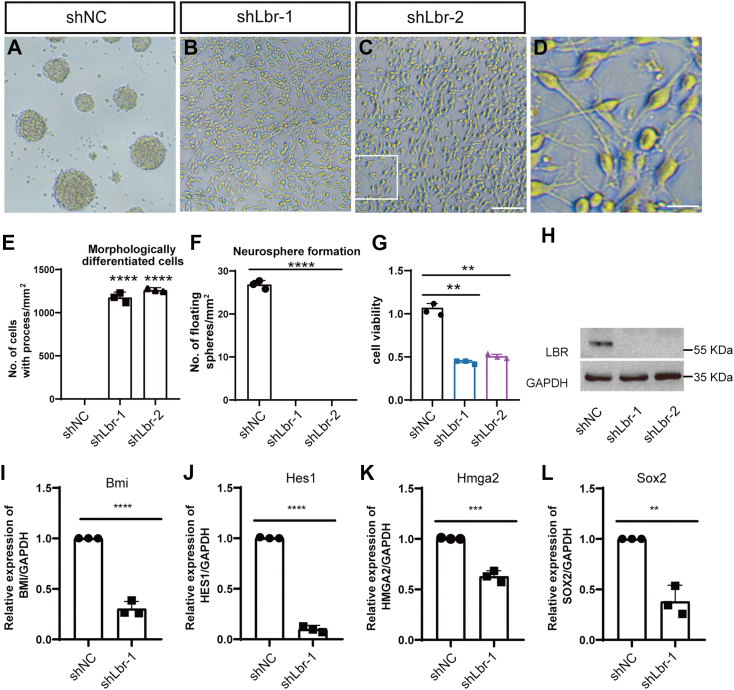
Figure 8
Cell culture of neural stem cells dissected from mouse brain.A–C, morphology of cells transfected with a scrambled control (shNC, A) and Lbr knock down lentivirus (shLbr-1 and shLbr-2, B and C). The scale bar represents 100 μm. D, the enlarged images from the boxed area in (C). The scale bar represents 25 μm. E and F, quantification of cells with processes (E) and the number of neurosphere formation (F). G, CCK8 analysis of cells transfected with Lbr lentivirus. H, Western blot reveals a dramatic decrease of LBR expression in cells transfected with shLbr-1 or shLbr-2. I–L, qPCR analysis of stemness-related genes. Data were shown as the mean ± SD. ∗∗, ∗∗∗, and ∗∗∗∗ denote p < 0.01, p < 0.001, p < 0.0001, respectively.